

Sensor Data Visualization Platform Case Study: How Kaopiz Built a Real-Time Monitoring Solution for Predictive Maintenance
As industrial operations become increasingly data-driven, organizations are collecting vast amounts of sensor data to improve equipment reliability, optimize maintenance schedules, and reduce operational risks. However, raw data alone offers limited value without the ability to visualize trends, identify anomalies, and generate actionable insights in real time.
For companies managing construction projects and real estate assets, early detection of abnormal equipment behavior can help prevent costly failures, minimize downtime, and improve operational efficiency. Achieving this requires a centralized platform capable of processing sensor data, presenting meaningful visualizations, and supporting secure access for multiple users and environments.
This sensor data visualization platform case study explores how Kaopiz helped a construction and real estate company develop a web-based monitoring solution that transforms real-time acceleration sensor data into intuitive visual insights. By integrating advanced analytics, FFT chart visualization, and multi-tenant management, the platform enables faster anomaly detection and more informed maintenance decisions.
Key Takeaways
- Client: Construction and real estate company leveraging IoT sensor data for predictive maintenance
- Industry: Construction Technology (ConTech) / Real Estate
- Scope: Development of a web-based sensor data visualization and monitoring platform
- Technology Stack: Vue.js, AWS, AWS Cognito
- Monitoring Efficiency: 48% improvement through centralized real-time dashboards
- Anomaly Detection: 57% faster identification of abnormal equipment behavior using FFT visualization
- Historical Analysis: 65% faster review of sensor performance through timeline-based data visualization
- Administrative Efficiency: 36% reduction in system administration effort with multi-tenant management
- Platform Scalability: Supports 2x monitoring capacity for future sensor deployments and operational expansion
The Client Background
Our client is a company operating in the construction and real estate industry, where equipment reliability and infrastructure performance play a critical role in daily operations. To strengthen predictive maintenance capabilities and improve operational efficiency, the company sought to make better use of acceleration sensor data collected from field devices.
As sensor deployments expanded across different locations, the organization required a centralized platform capable of transforming large volumes of raw sensor data into meaningful visual insights. The goal was to help operational teams monitor equipment conditions in real time, detect potential anomalies earlier, and make more informed maintenance decisions through a single, secure web application.
The Client’s Challenges
As sensor technologies become more widely adopted across industrial environments, collecting data is no longer the primary challenge. The real value lies in transforming continuous streams of sensor data into meaningful insights that enable faster decision-making and proactive maintenance.
For our client, building an effective monitoring solution required more than simply displaying sensor readings. The platform needed to provide real-time visibility, support advanced data analysis, and accommodate multiple user environments while remaining secure and scalable.
Problem 1: Raw Sensor Data Was Difficult to Interpret in Real Time
The client collected acceleration data from sensors deployed across operational assets, but raw numerical values alone provided limited visibility into equipment conditions. Without an intuitive visualization layer, operators found it difficult to identify abnormal vibration patterns or detect potential issues before they escalated into equipment failures.
To improve operational awareness, the client needed a platform capable of presenting real-time sensor data through clear, interactive visualizations that allowed users to quickly understand equipment behavior and respond proactively.
Problem 2: Limited Analytical Capabilities Reduced Predictive Maintenance Effectiveness
Beyond monitoring live data, the client required deeper analytical capabilities to support predictive maintenance initiatives. Existing workflows made it difficult to analyze vibration characteristics, compare historical trends, or identify subtle anomalies that indicate early signs of equipment deterioration.
The absence of advanced visualization tools, such as Fast Fourier Transform (FFT) charts, limited engineers’ ability to evaluate sensor data accurately and make informed maintenance decisions. A more comprehensive analytical environment was essential for improving asset reliability and reducing unexpected downtime.
Problem 3: Managing Multiple Sensor Environments Increased Operational Complexity
The platform needed to support multiple user groups, gateways, and sensor configurations across different operational environments. However, managing these environments through a single configuration reduced flexibility and made administration increasingly complex as the system expanded.
The client required a multi-tenant architecture that allowed each organization or user group to maintain independent configurations while ensuring centralized platform management and consistent system performance.
Problem 4: Secure Access and Centralized Monitoring Were Essential for Long-Term Scalability
As more users and connected devices were introduced, ensuring secure platform access became a critical requirement. The client needed a centralized monitoring dashboard that could provide authorized users with real-time operational visibility while protecting sensitive system data through reliable authentication mechanisms.
At the same time, the solution needed to establish a scalable foundation capable of supporting future sensor deployments, additional users, and evolving business requirements without significant architectural changes.
Our Solution: A Centralized Sensor Data Visualization Platform
Rather than building a standalone dashboard for displaying sensor readings, Kaopiz developed a comprehensive web-based platform that transforms raw acceleration data into actionable operational insights. The solution combines real-time monitoring, advanced data visualization, historical analysis, and secure user management within a single ecosystem, enabling operators to monitor equipment performance more efficiently and respond to potential issues proactively.
Using the client’s existing API infrastructure, the platform continuously collects sensor data and presents it through intuitive dashboards and analytical charts. Combined with flexible tenant management and cloud-based authentication, the solution provides a scalable foundation that supports growing sensor deployments while maintaining security, performance, and operational flexibility.
| Component | Primary Users | Purpose |
|---|---|---|
| Monitoring Dashboard | Operations teams, administrators | Monitor real-time acceleration sensor data through a centralized interface |
| FFT Visualization | Engineers, maintenance teams | Analyze vibration frequencies to identify abnormal equipment behavior |
| Historical Data Analysis | Operations managers, engineers | Review historical sensor trends for diagnostics and predictive maintenance |
| Tenant Management | System administrators | Configure independent settings for different organizations, gateways, and sensor environments |
| AWS Cognito Authentication | All users | Provide secure user authentication and role-based access management |
Centralized Monitoring Dashboard
The monitoring dashboard serves as the operational hub of the platform, providing users with a unified view of real-time acceleration sensor data collected from connected devices. Instead of switching between multiple monitoring tools, operators can track equipment conditions through a single interface, improving visibility across the entire monitoring environment.
The dashboard also simplifies daily operations by consolidating sensor information, device status, and monitoring activities into one centralized workspace. This enables faster response times and supports more efficient operational decision-making.
FFT Visualization for Early Anomaly Detection
To help engineers identify abnormal equipment behavior before failures occur, Kaopiz integrated Fast Fourier Transform visualization into the platform. Rather than relying solely on raw acceleration values, users can analyze vibration frequency patterns that reveal early signs of mechanical wear or abnormal operating conditions.
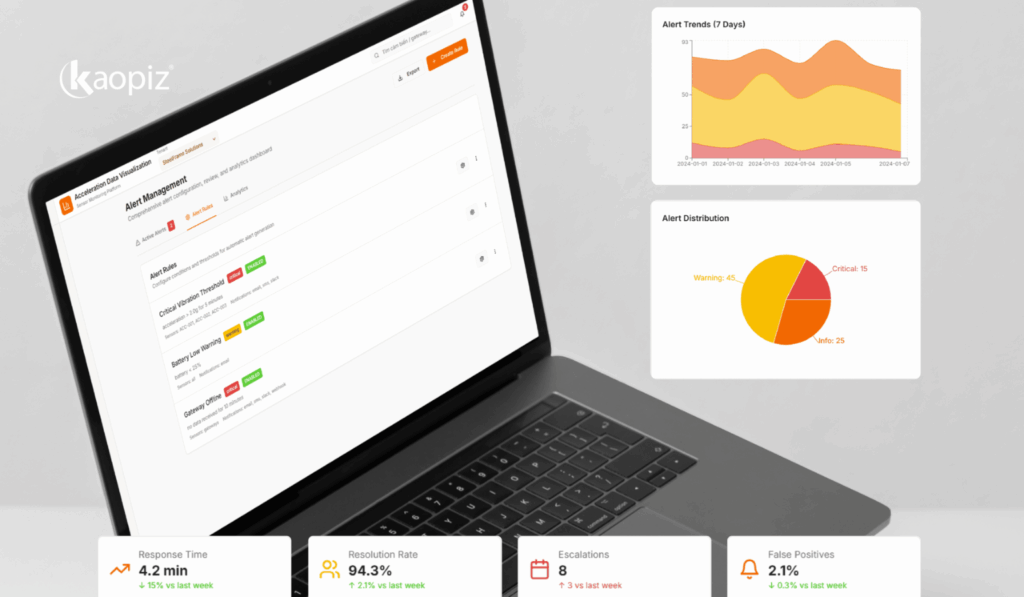
By presenting complex sensor data through intuitive FFT charts, the platform enables maintenance teams to perform deeper diagnostics and make more informed decisions regarding equipment inspection and preventive maintenance.
Historical Data Analysis
In addition to real-time monitoring, the platform allows users to review historical sensor data through timeline-based visualizations. Engineers can compare current readings with previous operational conditions, helping them identify recurring patterns, investigate incidents, and evaluate long-term equipment performance.
This historical perspective supports data-driven maintenance planning and enables organizations to transition from reactive maintenance toward more predictive operational strategies.
Flexible Multi-Tenant Configuration
Recognizing that different organizations and operational sites require independent configurations, Kaopiz designed the platform with a multi-tenant architecture. Each tenant can manage its own gateways, sensor settings, and monitoring environment without affecting other users on the platform.
This flexible architecture simplifies system administration while allowing the platform to scale efficiently as additional customers, facilities, or monitoring projects are introduced.
Secure Authentication with AWS Cognito
Security was incorporated into the platform from the outset through AWS Cognito integration. The authentication system provides secure user login and access control, ensuring that only authorized users can access monitoring data and administrative functions.
Combined with AWS cloud services, the solution delivers a reliable and scalable security framework capable of supporting enterprise-level deployments as the client’s monitoring ecosystem continues to expand.
How Kaopiz Designed and Delivered the Sensor Data Visualization Platform
Developing a sensor data visualization platform required more than connecting devices to a dashboard. The solution needed to process continuous streams of sensor data, present complex analytical information in an intuitive format, and remain flexible enough to support different operational environments as the client’s business expanded.
To achieve these objectives, Kaopiz adopted a structured development approach that combined business analysis, user-centered design, and iterative development. This ensured the platform addressed current operational needs while providing a scalable architecture for future enhancements.
Discovery and Operational Workflow Analysis
The project began with a discovery phase to understand how the client collected, processed, and utilized sensor data across its operations. Working closely with stakeholders, the team analyzed monitoring workflows, maintenance processes, and user requirements to identify opportunities for improving visibility and operational efficiency.
These insights guided the overall system architecture, ensuring that the platform supported real-world monitoring scenarios while remaining flexible enough to accommodate future sensor deployments and evolving business requirements.
User-Centered Dashboard Design
Presenting large volumes of sensor data effectively was one of the project’s key priorities. Rather than overwhelming users with raw numerical values, Kaopiz designed intuitive dashboards and visualization components that highlighted critical operational information at a glance.
Special attention was given to FFT charts, historical trend visualization, and navigation flows, allowing engineers and operational teams to interpret sensor data more quickly and identify abnormal equipment behavior with greater confidence.
Agile Development and Continuous Validation
The platform was delivered using an agile development methodology, enabling new functionalities to be implemented and validated through iterative development cycles. Continuous collaboration with the client ensured that every feature aligned with operational requirements while allowing priorities to evolve throughout the project.
Comprehensive testing was performed throughout development to verify data accuracy, platform stability, and overall system performance. This iterative approach minimized development risks and resulted in a reliable monitoring platform capable of supporting enterprise-scale sensor deployments.
Technology Stack Behind the Sensor Data Visualization Platform
Selecting the right technology stack was essential to building a platform capable of processing real-time sensor data while delivering a responsive user experience. Kaopiz adopted modern web technologies and cloud services that balanced performance, scalability, and security, ensuring the platform could support both current operational needs and future expansion.
Each technology was chosen to address a specific aspect of the solution, from interactive data visualization and secure user authentication to reliable cloud infrastructure. Together, they established a robust foundation for a scalable sensor monitoring platform.
Vue.js for Interactive Data Visualization
The web application was developed using Vue.js to deliver a fast, responsive, and highly interactive user experience. Its component-based architecture enabled the development team to build reusable visualization modules, making it easier to manage dashboards, FFT charts, historical data views, and tenant-specific configurations.
Vue.js also provided the flexibility to support future feature enhancements without affecting the overall user experience. This allowed the client to continuously expand the platform while maintaining consistent performance across different monitoring environments.
AWS for Scalable Cloud Infrastructure
Kaopiz leveraged AWS to provide a reliable cloud infrastructure capable of supporting continuous sensor monitoring and real-time data visualization. The cloud environment ensured high availability while allowing the platform to scale efficiently as additional devices, users, and monitoring environments were introduced.
Beyond scalability, AWS also strengthened the platform’s operational reliability. Its cloud services enabled secure data management and stable system performance, creating a dependable foundation for long-term platform growth.
AWS Cognito for Secure User Authentication
To ensure secure access across multiple organizations and user groups, the platform integrated AWS Cognito for authentication and identity management. The solution provided centralized user authentication while simplifying login, account administration, and access control for different tenant environments.
This approach enhanced platform security without adding unnecessary complexity for end users. By protecting sensitive monitoring data through enterprise-grade authentication, the client could confidently expand the platform while maintaining strong security standards.
Manual Testing for System Reliability
Maintaining data accuracy and platform stability was a key priority throughout development. Kaopiz conducted comprehensive manual testing to validate sensor data visualization, FFT chart rendering, authentication workflows, tenant configurations, and overall application performance under various operational scenarios.
Continuous testing throughout the project helped identify potential issues early and ensured that every feature performed reliably before deployment. This quality-focused approach minimized implementation risks and delivered a stable monitoring platform capable of supporting day-to-day business operations.
Results: Improving Visibility, Operational Efficiency, and Predictive Maintenance
Following the platform deployment, the client gained a centralized environment for monitoring acceleration sensor data across multiple operational sites. By consolidating real-time visualization, historical analysis, and tenant management into a single platform, the solution simplified monitoring workflows while providing greater visibility into equipment performance.
The platform also established a scalable digital foundation for predictive maintenance. Engineers and operations teams could detect abnormal vibration patterns earlier, investigate historical trends more efficiently, and manage sensor environments through a unified dashboard instead of relying on fragmented monitoring tools.
| Metric | Outcome | Business Impact |
|---|---|---|
| Monitoring Efficiency | 48% improvement | Faster identification of abnormal equipment behavior through centralized dashboards |
| Time to Detect Anomalies | 57% reduction | Earlier identification of potential equipment issues before operational disruptions |
| Historical Data Analysis | 65% faster | Accelerated investigation of equipment performance and maintenance history |
| Administrative Workload | 36% reduction | Simplified tenant configuration and user management through centralized administration |
| Platform Scalability | 2× monitoring capacity | Supports additional sensors, gateways, and organizations without significant infrastructure changes |
Faster Monitoring Through Centralized Data Visualization: 48% Efficiency Gain
Before implementing the platform, engineers needed to review sensor information across multiple interfaces and manually interpret raw acceleration data. This fragmented workflow slowed operational monitoring and delayed responses to abnormal equipment conditions.
By introducing a centralized monitoring dashboard with real-time visualization, the client improved monitoring efficiency by approximately 48%. Operational teams could identify unusual sensor behavior more quickly, allowing maintenance activities to be initiated before issues escalated into equipment failures. The unified dashboard also reduced the time required to monitor multiple assets simultaneously, enabling faster operational decision-making.
Earlier Anomaly Detection with Advanced Analytics: 57% Faster Identification
The integration of FFT charts significantly enhanced the client’s ability to analyze vibration characteristics beyond standard sensor readings. Engineers could detect subtle frequency changes that indicate early signs of mechanical wear or abnormal operating conditions.
As a result, the average time required to identify potential anomalies was reduced by 57%. Faster access to vibration analysis enabled maintenance teams to investigate abnormal conditions earlier, reducing the likelihood of unexpected equipment failures and supporting a more proactive maintenance strategy.
More Efficient Historical Analysis and System Administration: 65% and 36% Gains
Historical sensor records became substantially easier to access through timeline-based visualization and centralized data management. Instead of manually collecting data from different sources, users could review historical trends directly within the platform to support diagnostics, maintenance planning, and long-term performance analysis.
The platform also accelerated historical data analysis by 65%, allowing engineers to retrieve and evaluate sensor records much more efficiently. At the same time, centralized tenant management reduced administrative workload by approximately 36%, simplifying user administration and configuration management across multiple organizations and gateway environments.
Built to Support Future Growth: 2× Monitoring Capacity
Beyond improving day-to-day monitoring, the platform established a scalable foundation for the client’s long-term IoT initiatives. Its cloud-based architecture and multi-tenant design allow additional sensors, gateways, and operational sites to be integrated without disrupting existing monitoring activities.
With infrastructure capable of supporting approximately twice the original monitoring capacity, the client can confidently expand sensor deployments while maintaining stable platform performance. This scalability ensures the solution can evolve alongside future operational requirements without requiring significant architectural redesign.
What Makes Sensor Data Visualization Different from Traditional Equipment Monitoring?
In my experience, many organizations already collect large volumes of sensor data. The challenge is rarely the data itself, it’s turning that continuous stream of information into actionable insights before equipment performance begins to deteriorate. Without meaningful visualization and analytical tools, even the most sophisticated sensors provide limited operational value.
Modern sensor monitoring platforms must go beyond displaying real-time readings. They need to combine historical analysis, anomaly detection, and intuitive dashboards so engineers can quickly identify abnormal patterns and make informed maintenance decisions. That’s what transforms raw sensor data into a practical tool for predictive maintenance.
Is This Platform Right for Your Organization?
A custom sensor data visualization platform is often the right choice for organizations managing multiple assets, monitoring environments, or large-scale IoT deployments. As the number of connected devices grows, relying on isolated dashboards or manual analysis becomes increasingly difficult and limits operational efficiency.
If your business needs real-time monitoring, historical trend analysis, secure multi-user access, and a scalable cloud architecture, a tailored platform can provide greater long-term value while supporting future expansion and predictive maintenance initiatives.
Conclusion
Building an effective sensor data visualization platform case study requires more than collecting information from connected devices. Organizations need a solution that transforms complex sensor data into clear, actionable insights that support faster decision-making and long-term operational efficiency.
In this project, Kaopiz helped a construction and real estate company develop a centralized monitoring platform featuring real-time visualization, FFT analysis, historical data review, secure authentication, and flexible multi-tenant management. The result is a scalable foundation that improves predictive maintenance today while supporting future IoT expansion.
FAQs
- What Is a Sensor Data Visualization Platform?
- A sensor data visualization platform collects, processes, and displays real-time sensor information through interactive dashboards and analytical charts, helping organizations monitor equipment performance and detect anomalies more efficiently.
- Why Are FFT Charts Important for Predictive Maintenance?
- FFT (Fast Fourier Transform) charts convert vibration signals into frequency-based visualizations, making it easier to identify abnormal patterns that indicate mechanical wear or potential equipment failure before problems become critical.
- Why Choose a Custom Sensor Monitoring Platform Instead of an Off-the-Shelf Solution?
- A custom platform can be tailored to your operational workflows, integrate with existing systems, support multi-tenant environments, and scale alongside your growing IoT infrastructure, capabilities that standard monitoring solutions often cannot fully provide.
- Can the Platform Scale as More Sensors Are Deployed?
- Yes. Built on AWS with a flexible multi-tenant architecture, the platform is designed to accommodate additional sensors, gateways, users, and operational sites while maintaining reliable performance and secure access.
- How Long Does It Take to Build a Sensor Data Visualization Platform?
- Timelines depend on the number of integrations, sensor types, and dashboard complexity required. Kaopiz uses an agile development approach with discovery, design, and iterative build phases, allowing core monitoring features to launch first and advanced analytics such as FFT visualization to follow in subsequent sprints.
Author

Table of Contents
Don’t miss what’s next!
Thank you! Your form has been submitted successfully.