
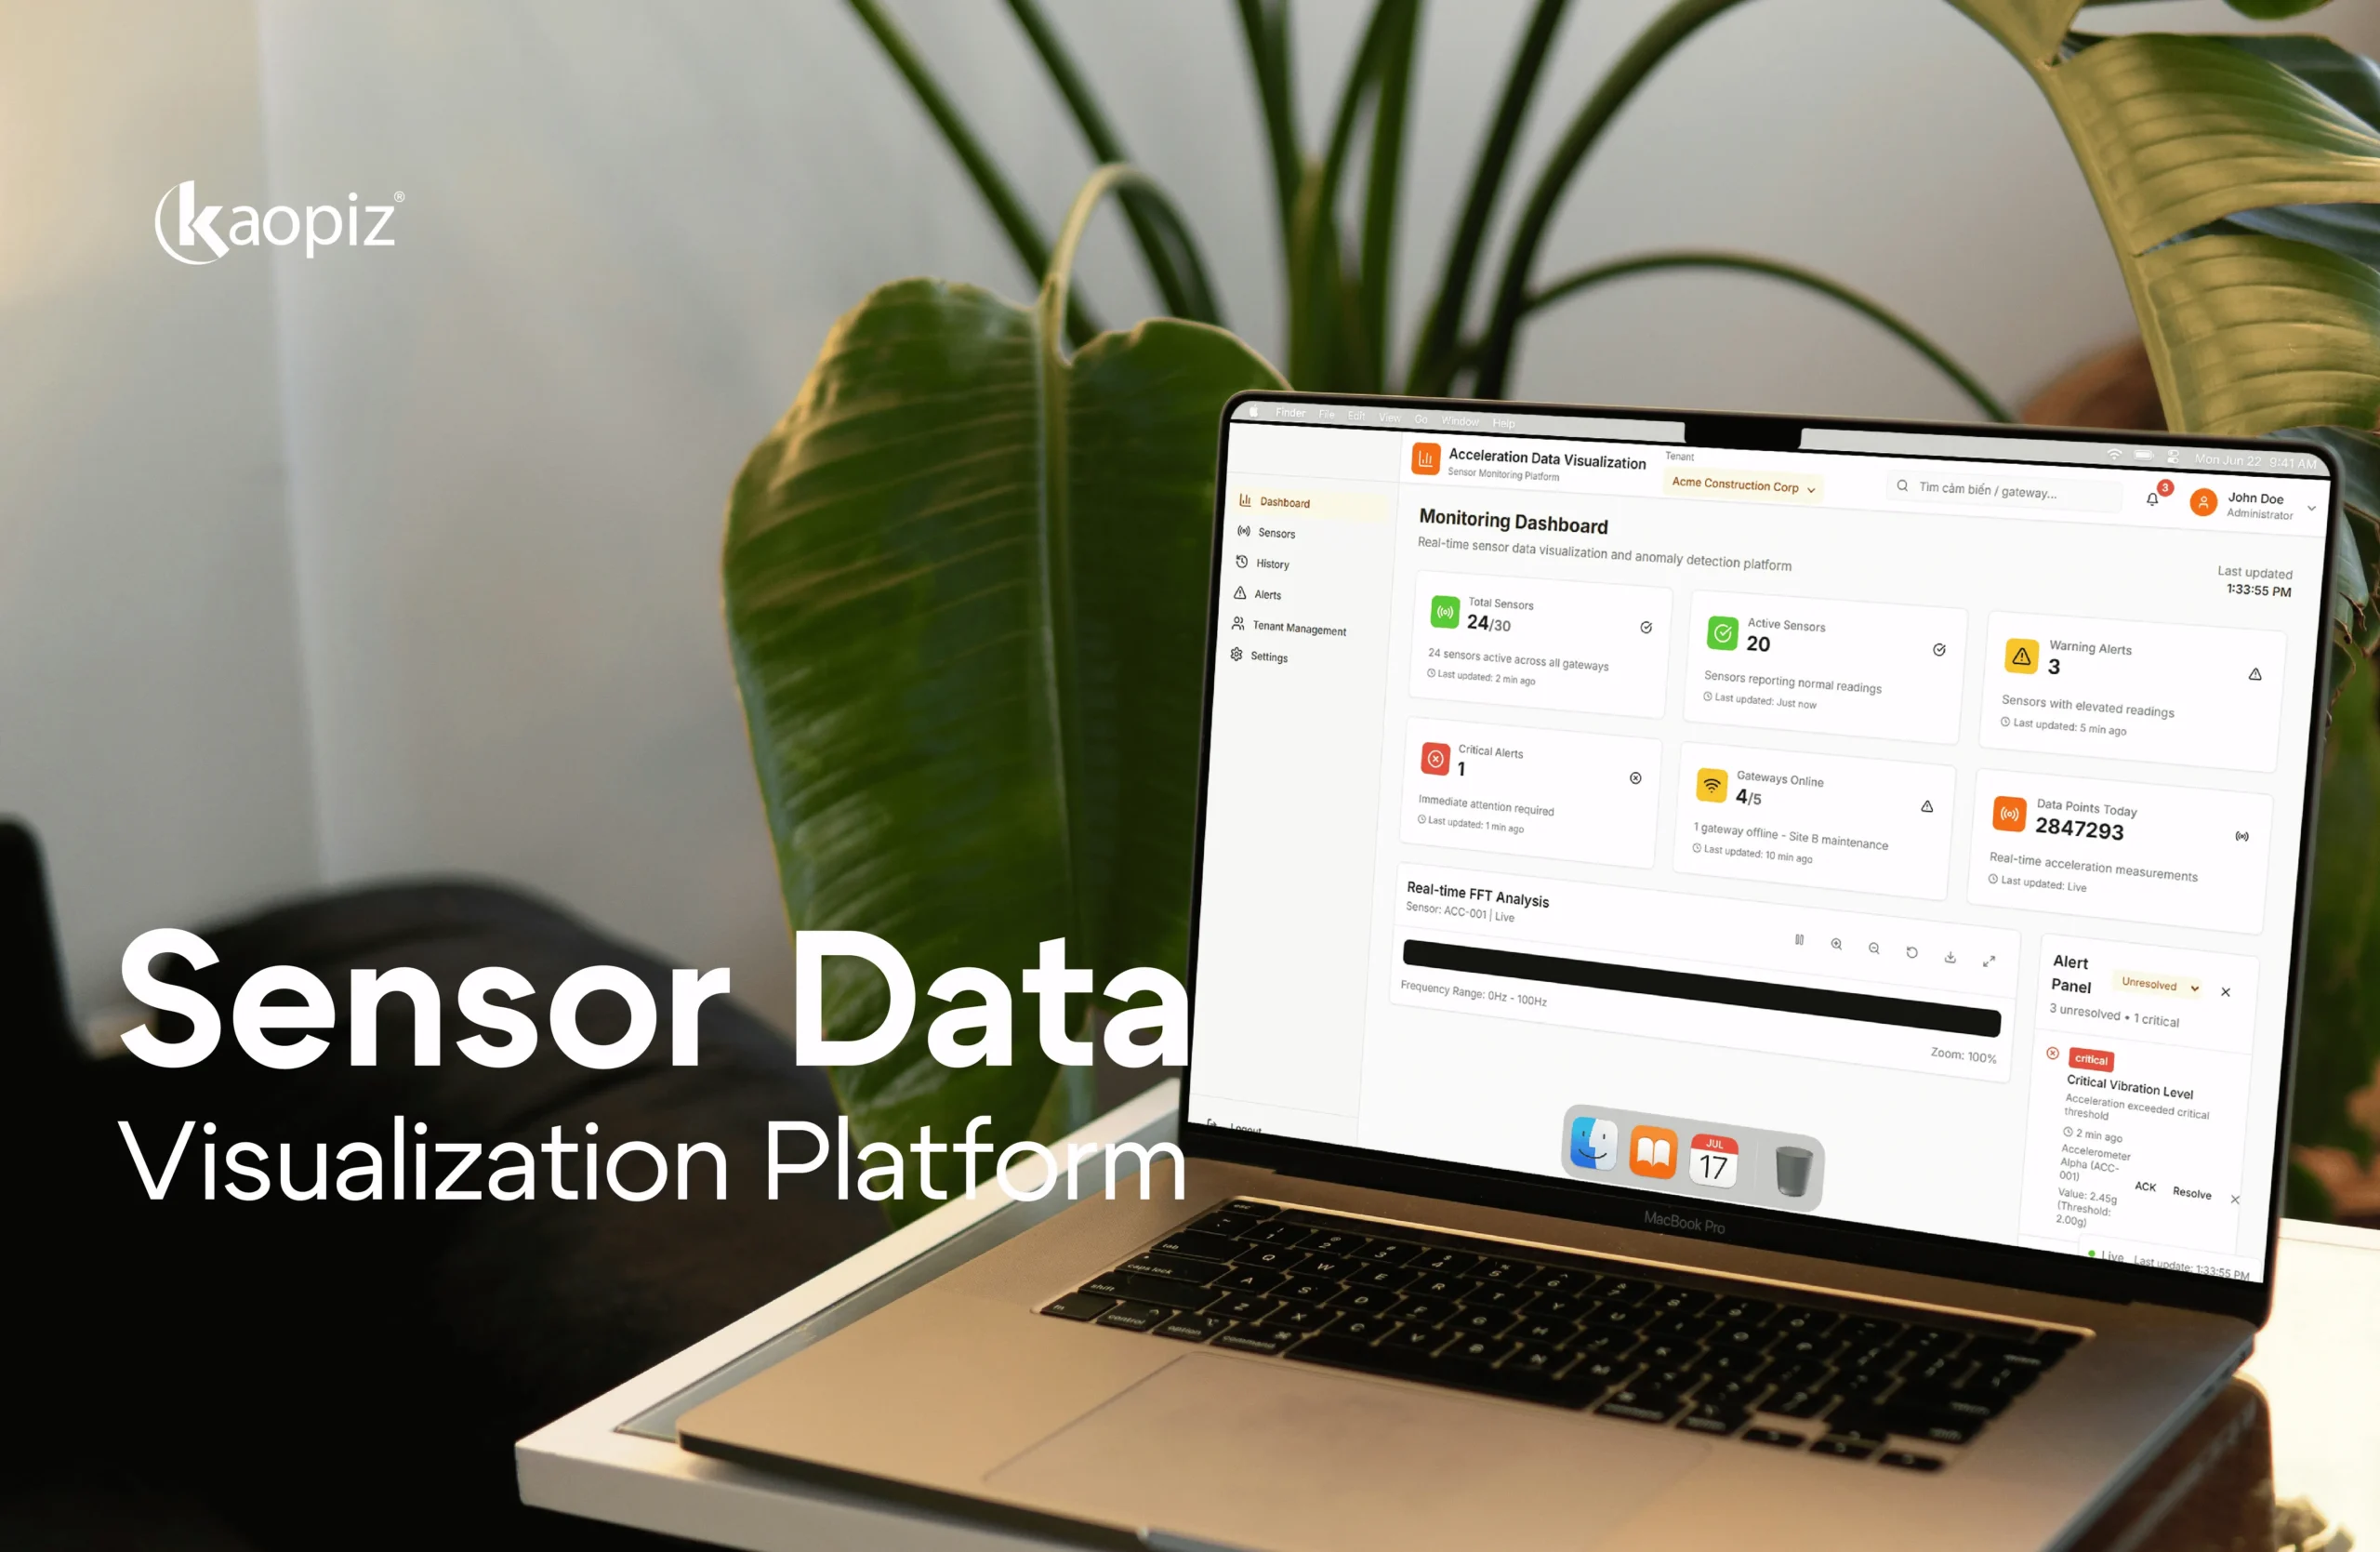
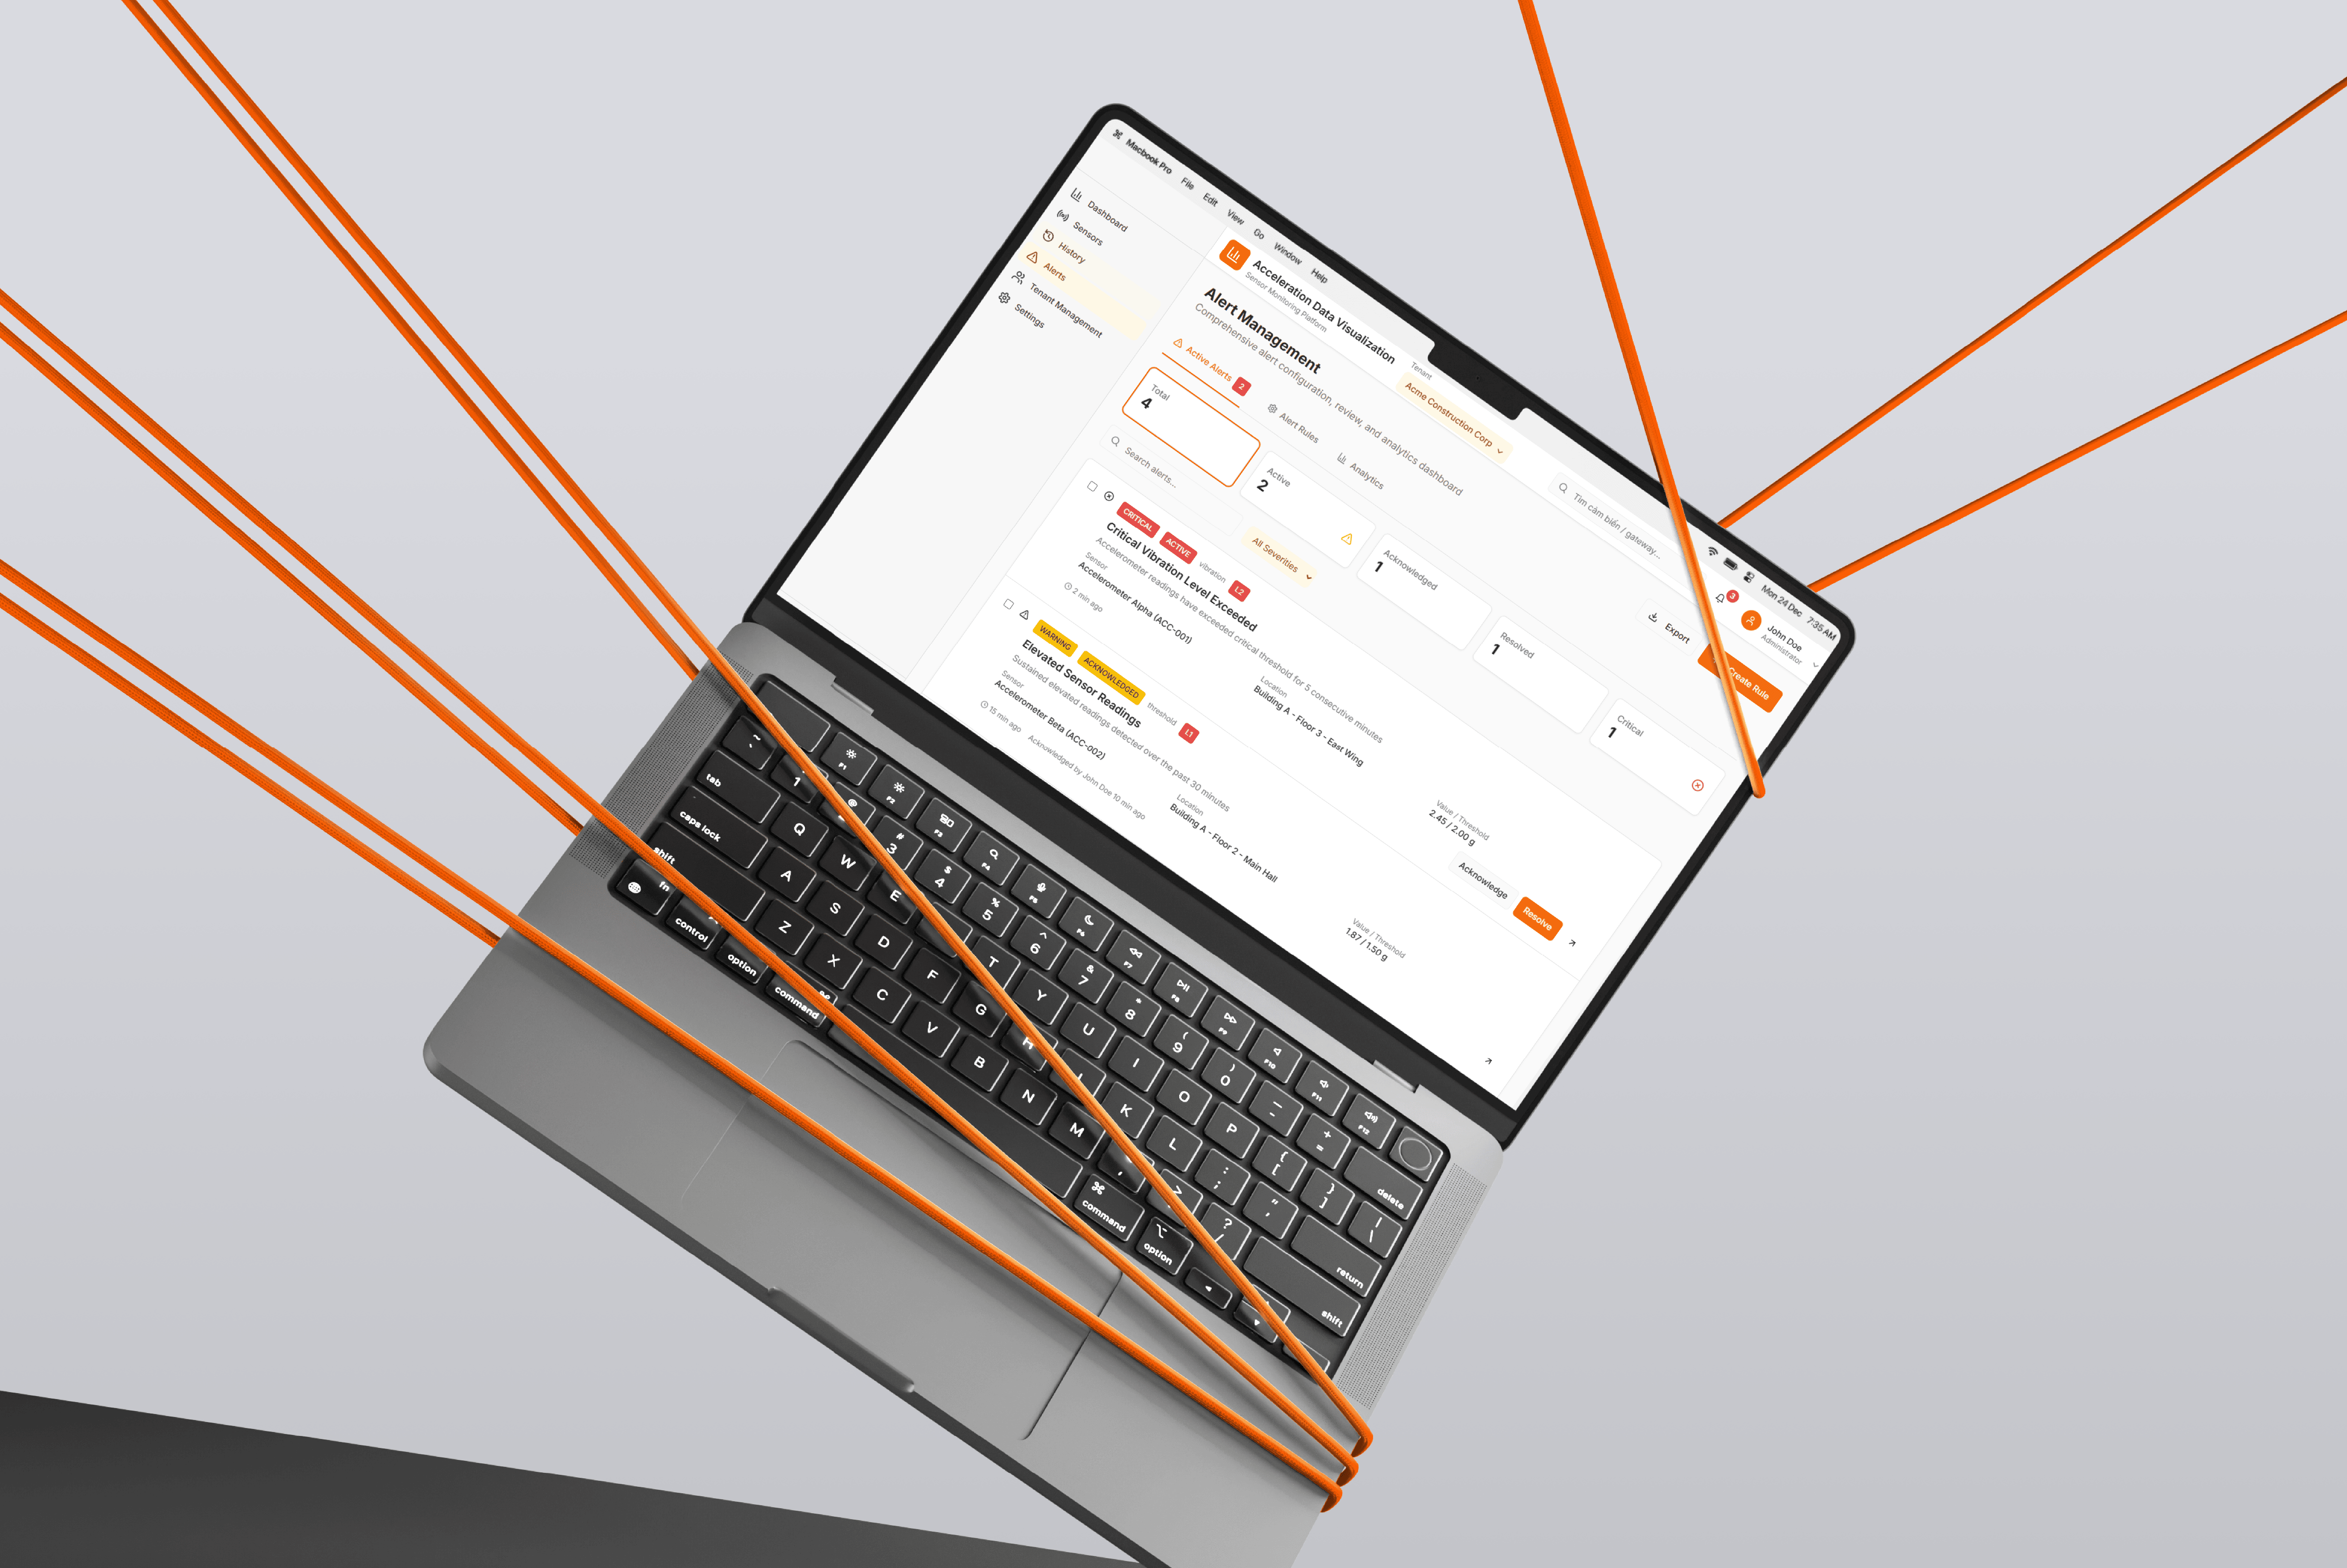
Sensor Data Visualization Platform
Developed a real-time system for analyzing and visualizing acceleration sensor data via FFT charts.
Client
A construction and real estate company
Industry
Construction
Country
Japan
Client Background
A company operating in construction and real estate, aiming to leverage sensor data for predictive maintenance and operational optimization. They needed a platform to visualize real-time acceleration data and enable anomaly detection through advanced analytics.
Challenge
The client required a web-based solution to visualize acceleration sensor data, detect anomalies early, and review historical trends. FFT chart integration and secure user management were essential, along with customization for multi-tenant environments.
Our Solutions
Using the client's API, we built a system for real-time sensor data collection and visualization. Features included FFT chart rendering, flexible configuration of sensors, and secure login with AWS Cognito. Multi-tenant support allowed individual settings per user environment.
Core Technologies
2/3
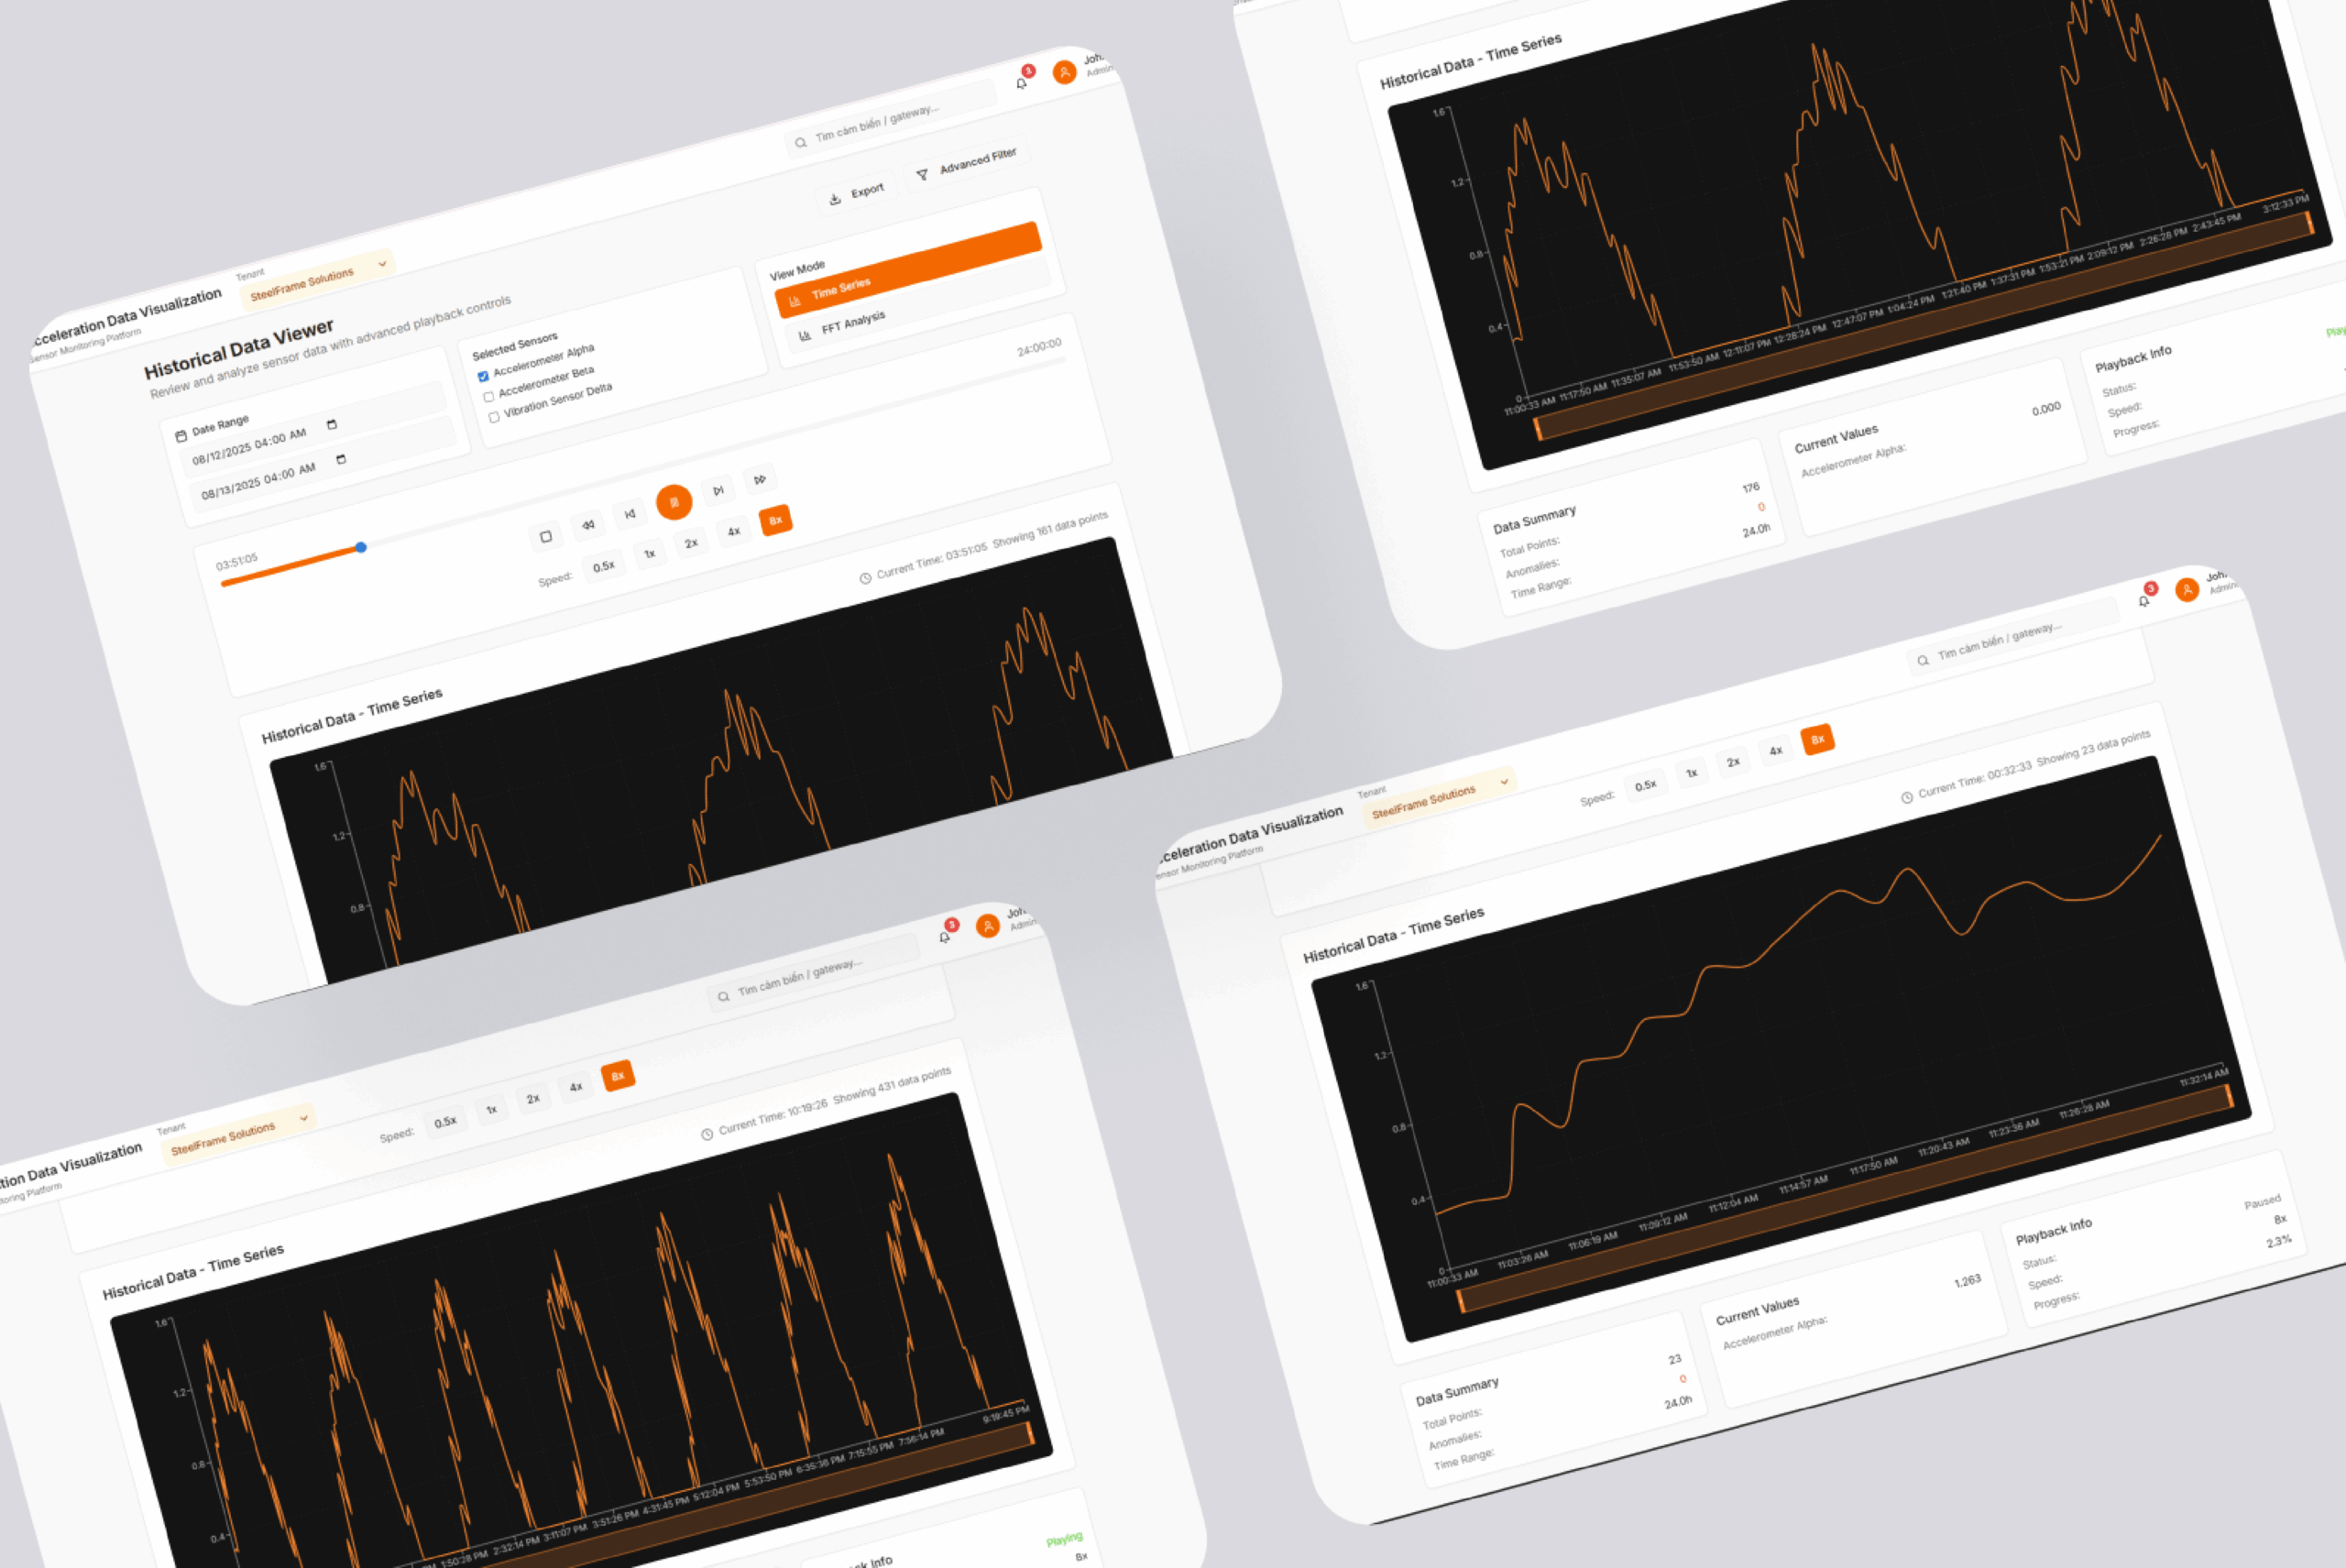
FFT Chart for Vibration Analysis
Historical Sensor Data Trends
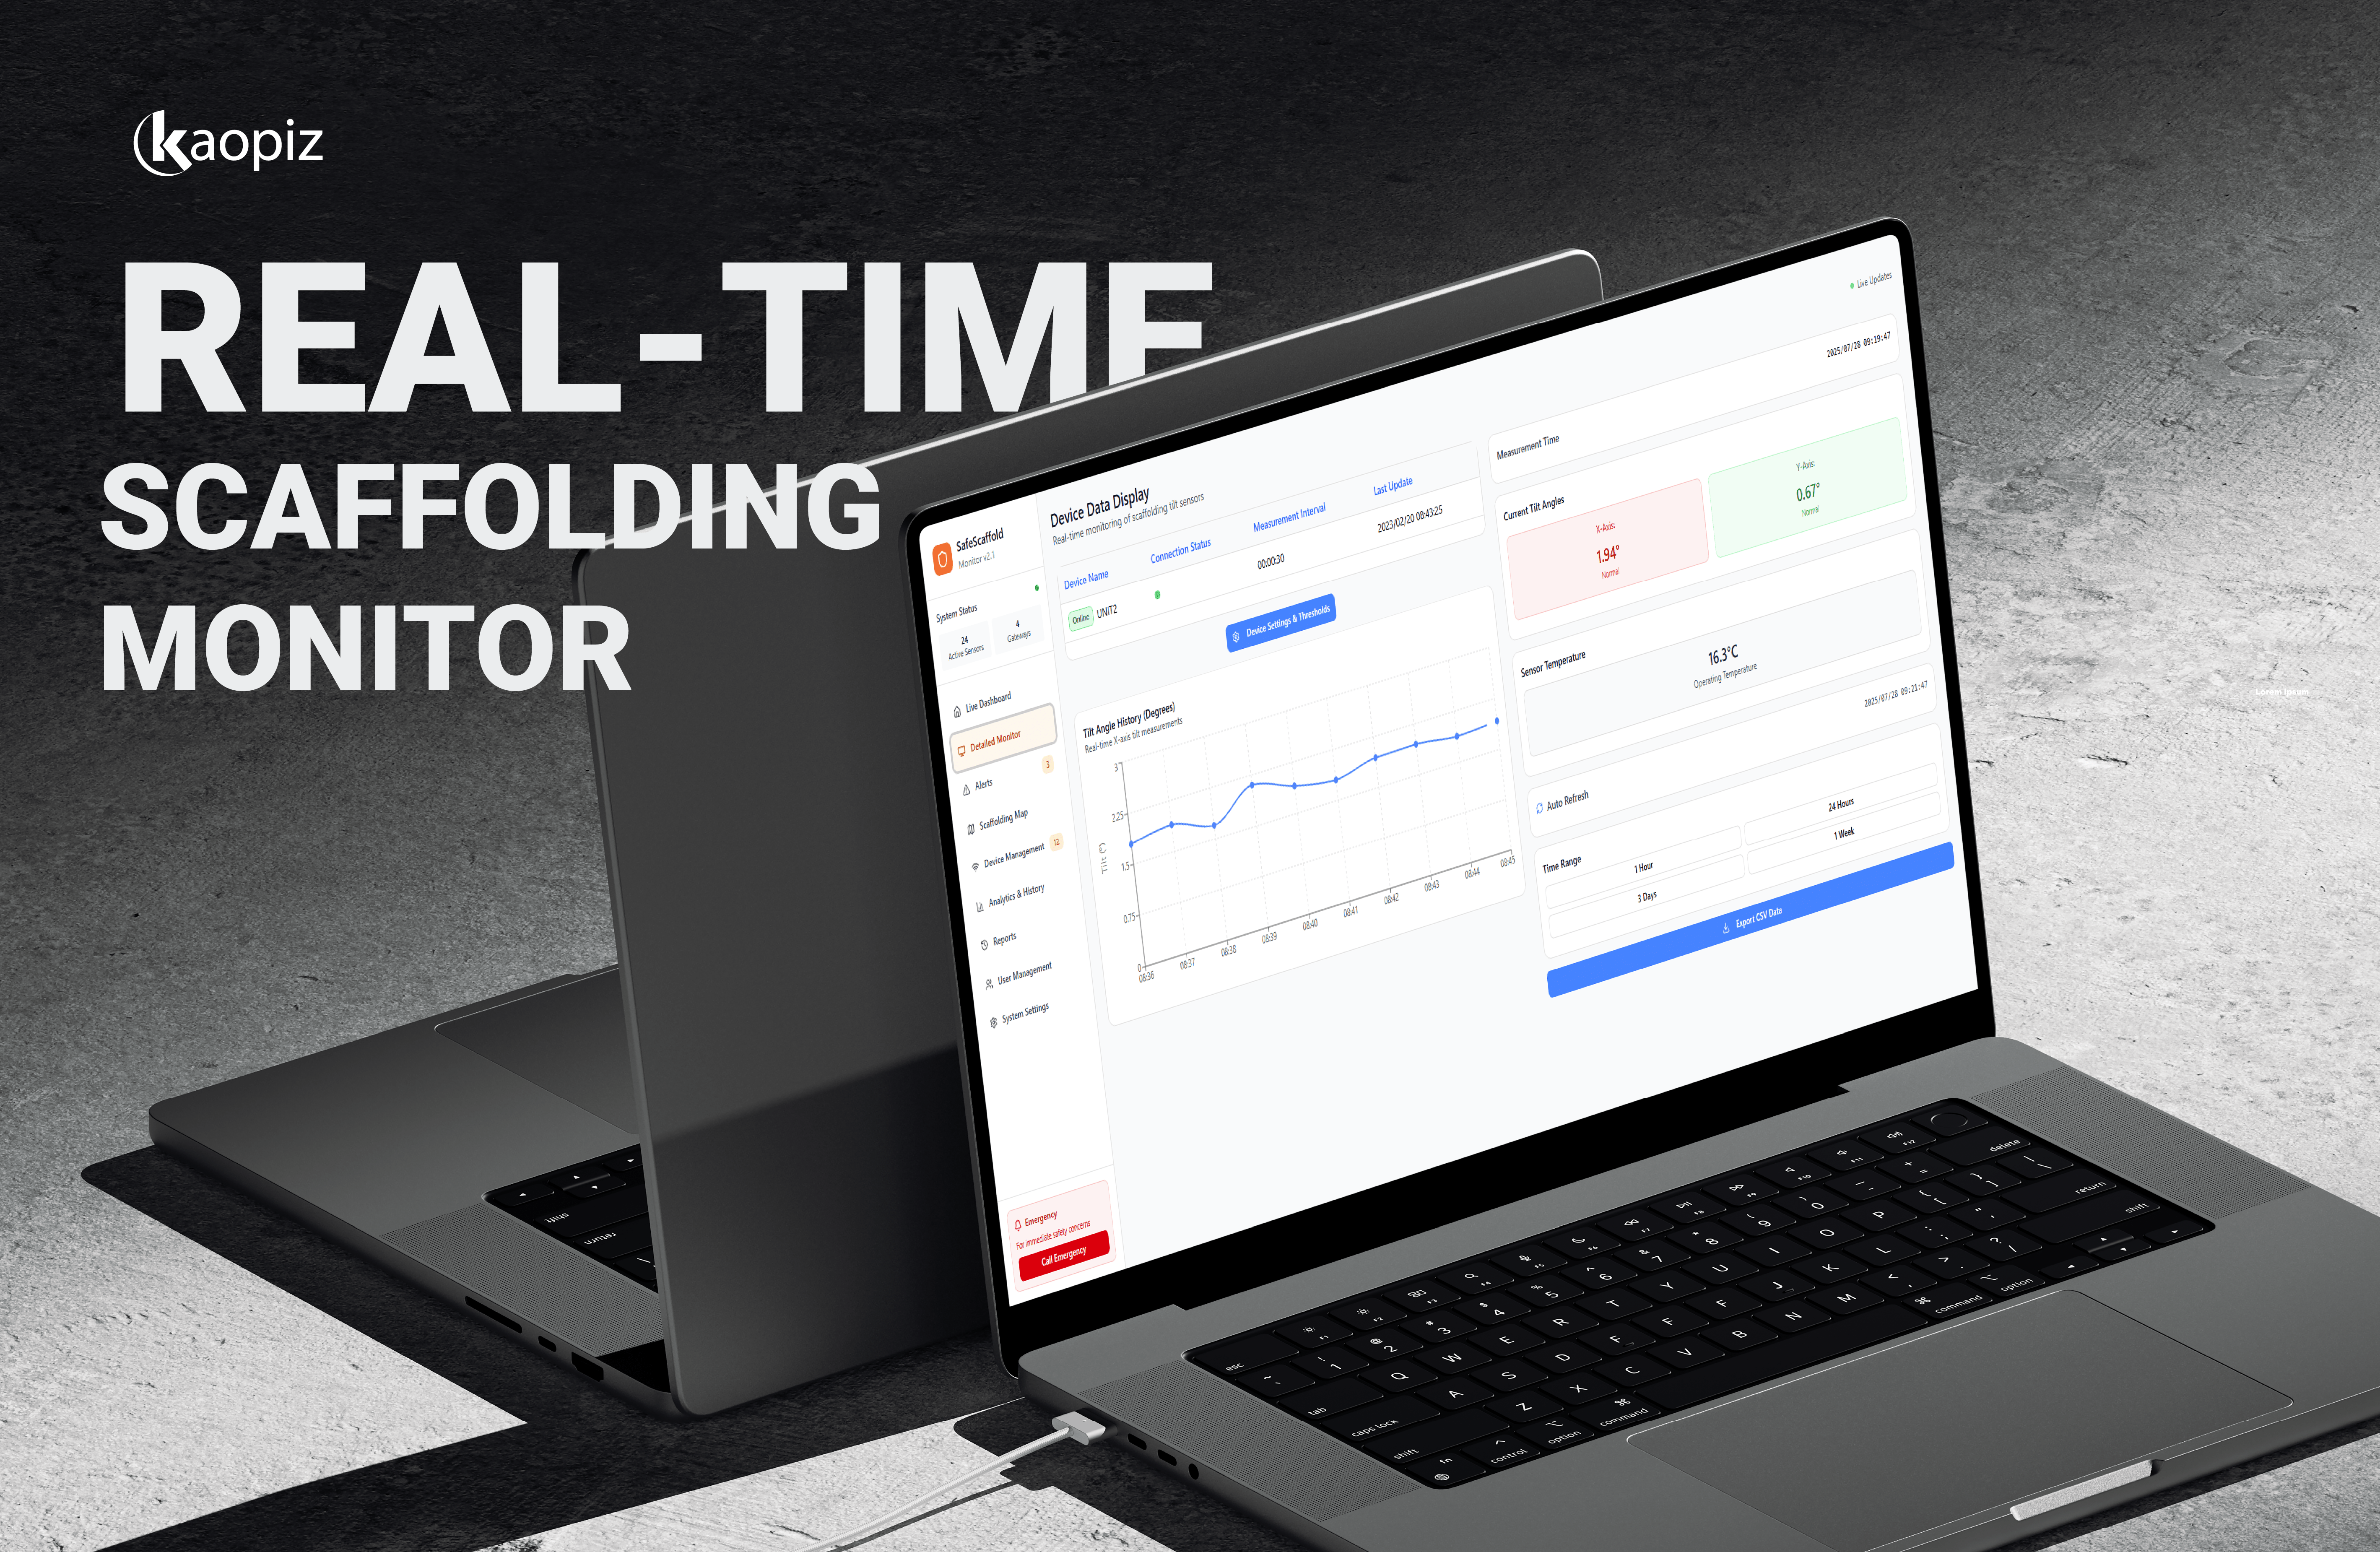
Live Data Visualization
Real-Time Sensor Monitoring Dashboard
Core Technologies
Frontend
Vue.js
Cloud
AWS, AWS Cognito
Devices
PC
Testing
Manual Testing
Features of the App
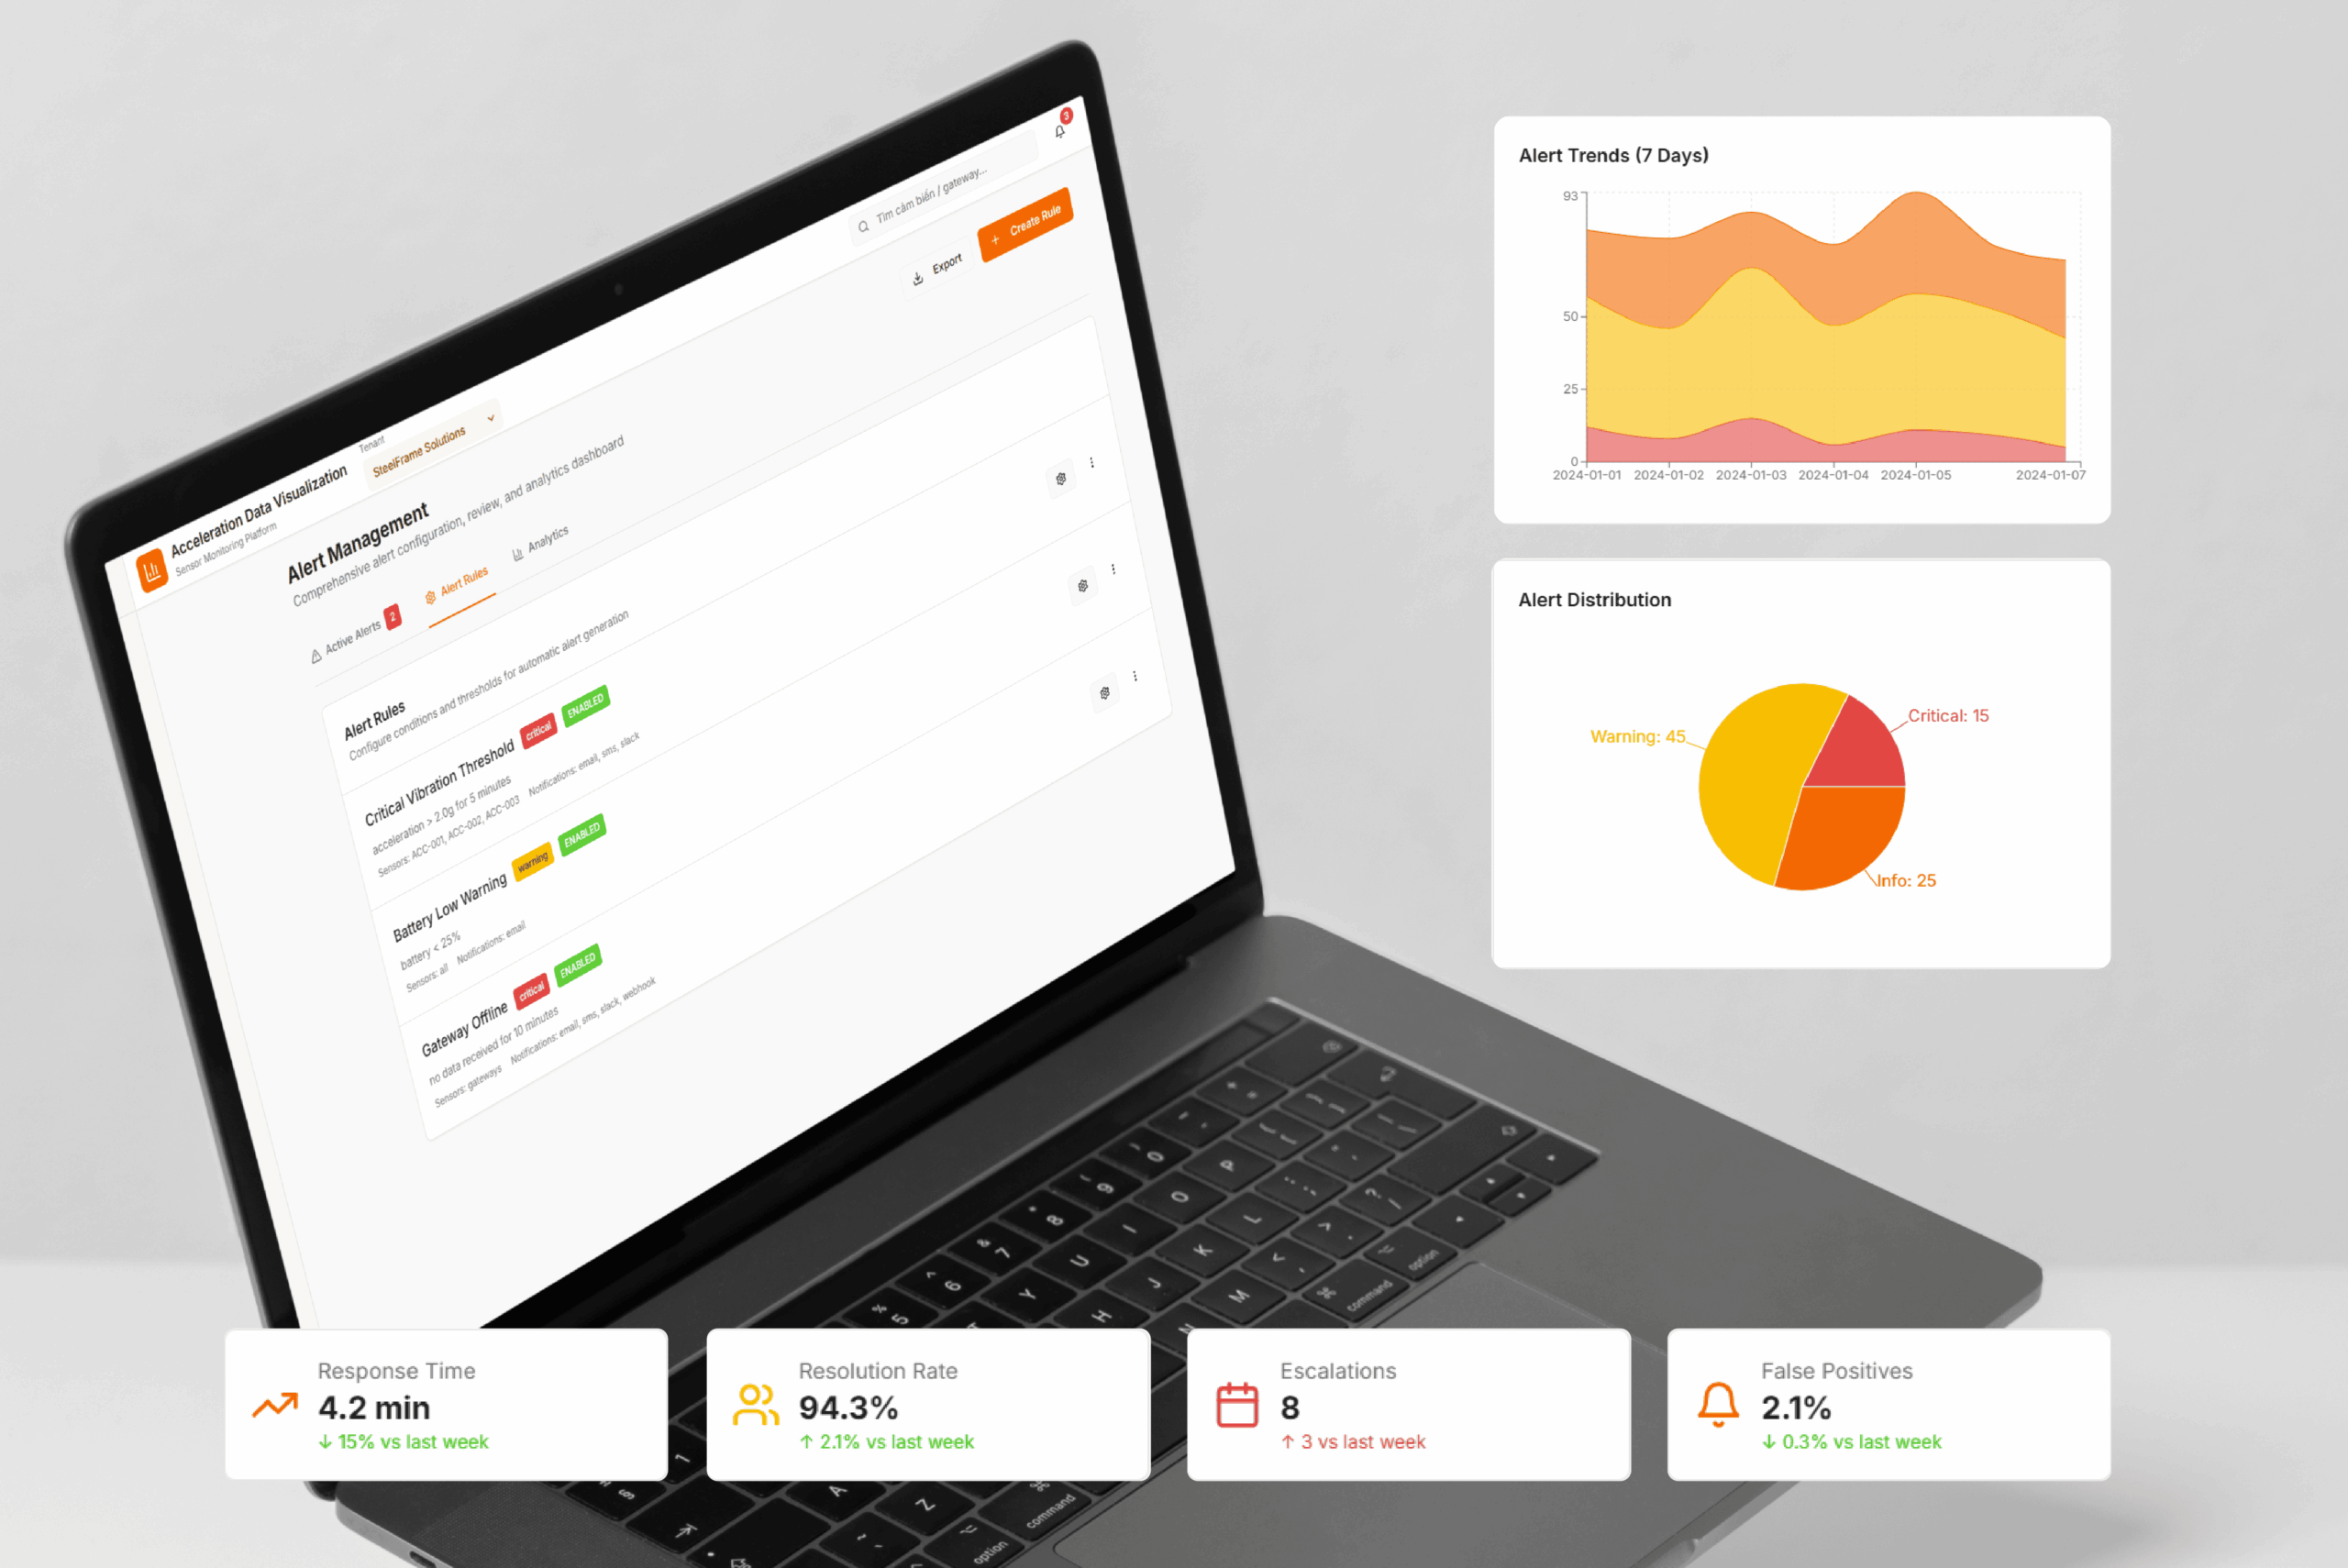
FFT Charts
Visualizes vibration trends for anomaly detection
Historical Data
Enables timeline-based performance review
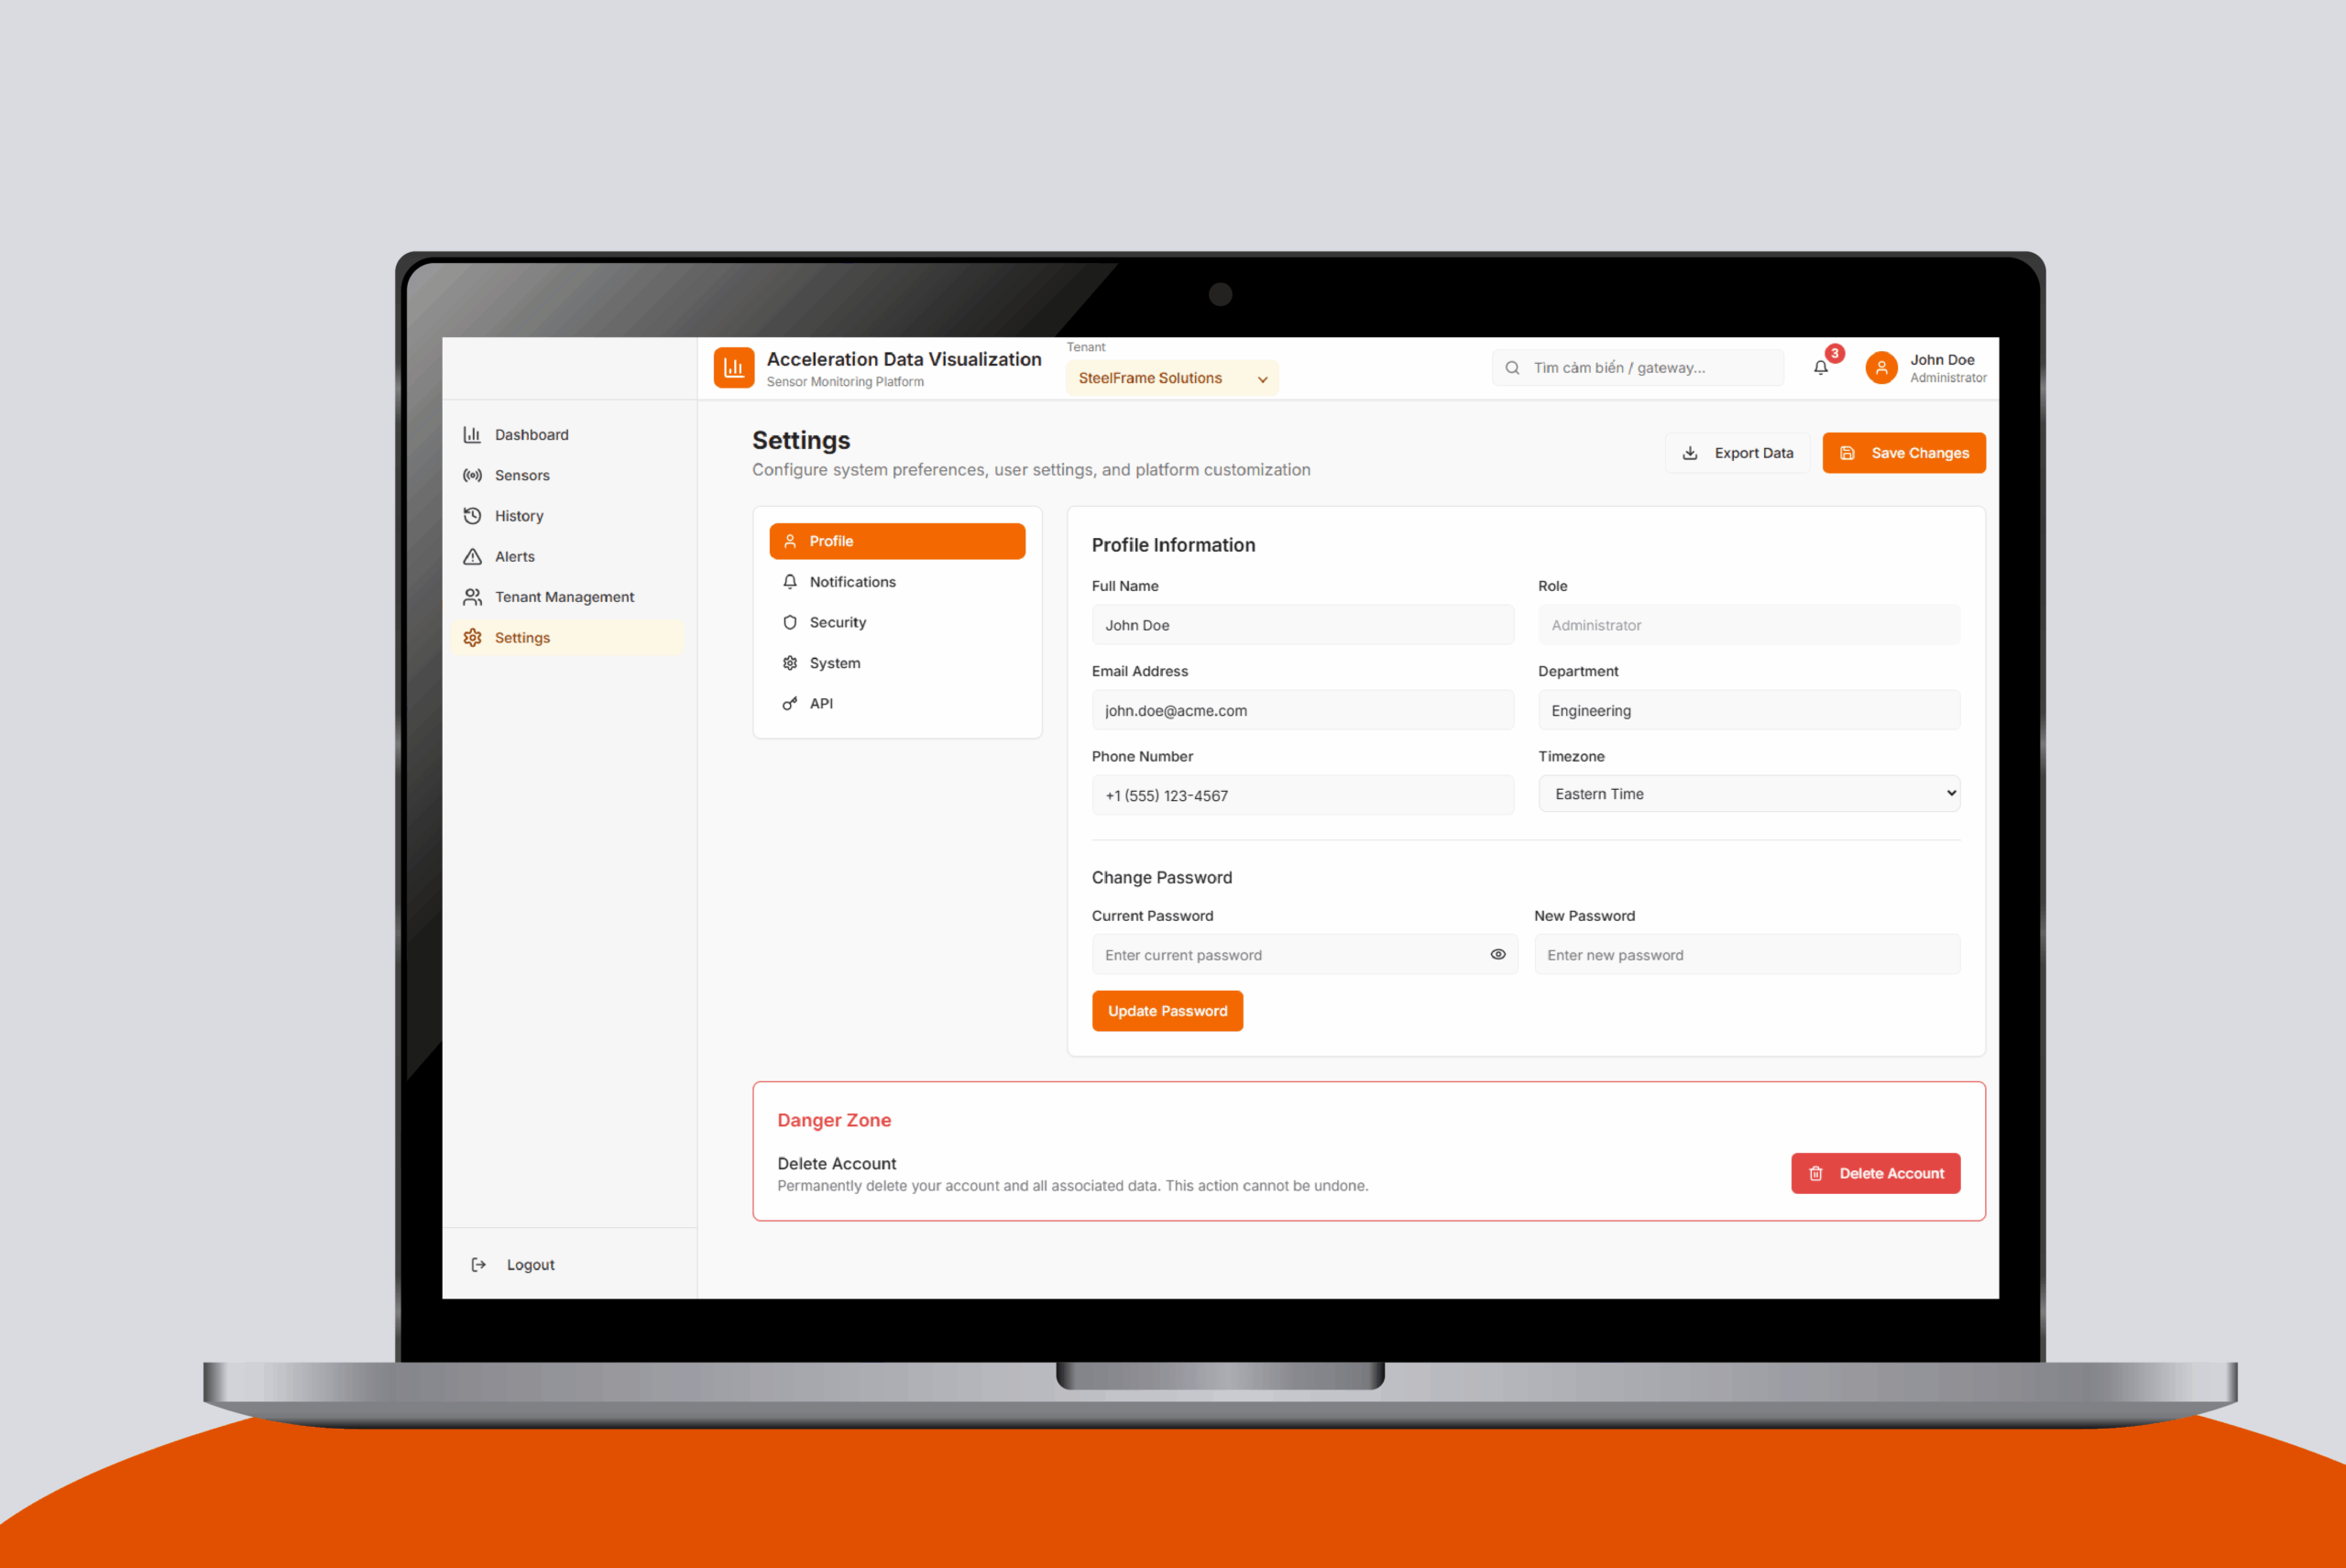
Tenant Settings
Custom configuration per group or gateway
Secure Login
AWS Cognito-based user authentication
Monitoring Dashboard
Centralized sensor management
Business Values
Increased Efficiency
Real-time asset monitoring helped the client improve fleet
utilization and reduce idle time.
Reduced Operational Costs
Predictive maintenance capabilities allowed the client to address
issues before they escalated, cutting repair costs and downtime.
Improved Decision Making
The system's comprehensive dashboard provided actionable insights,
helping the client optimize their asset management strategies.
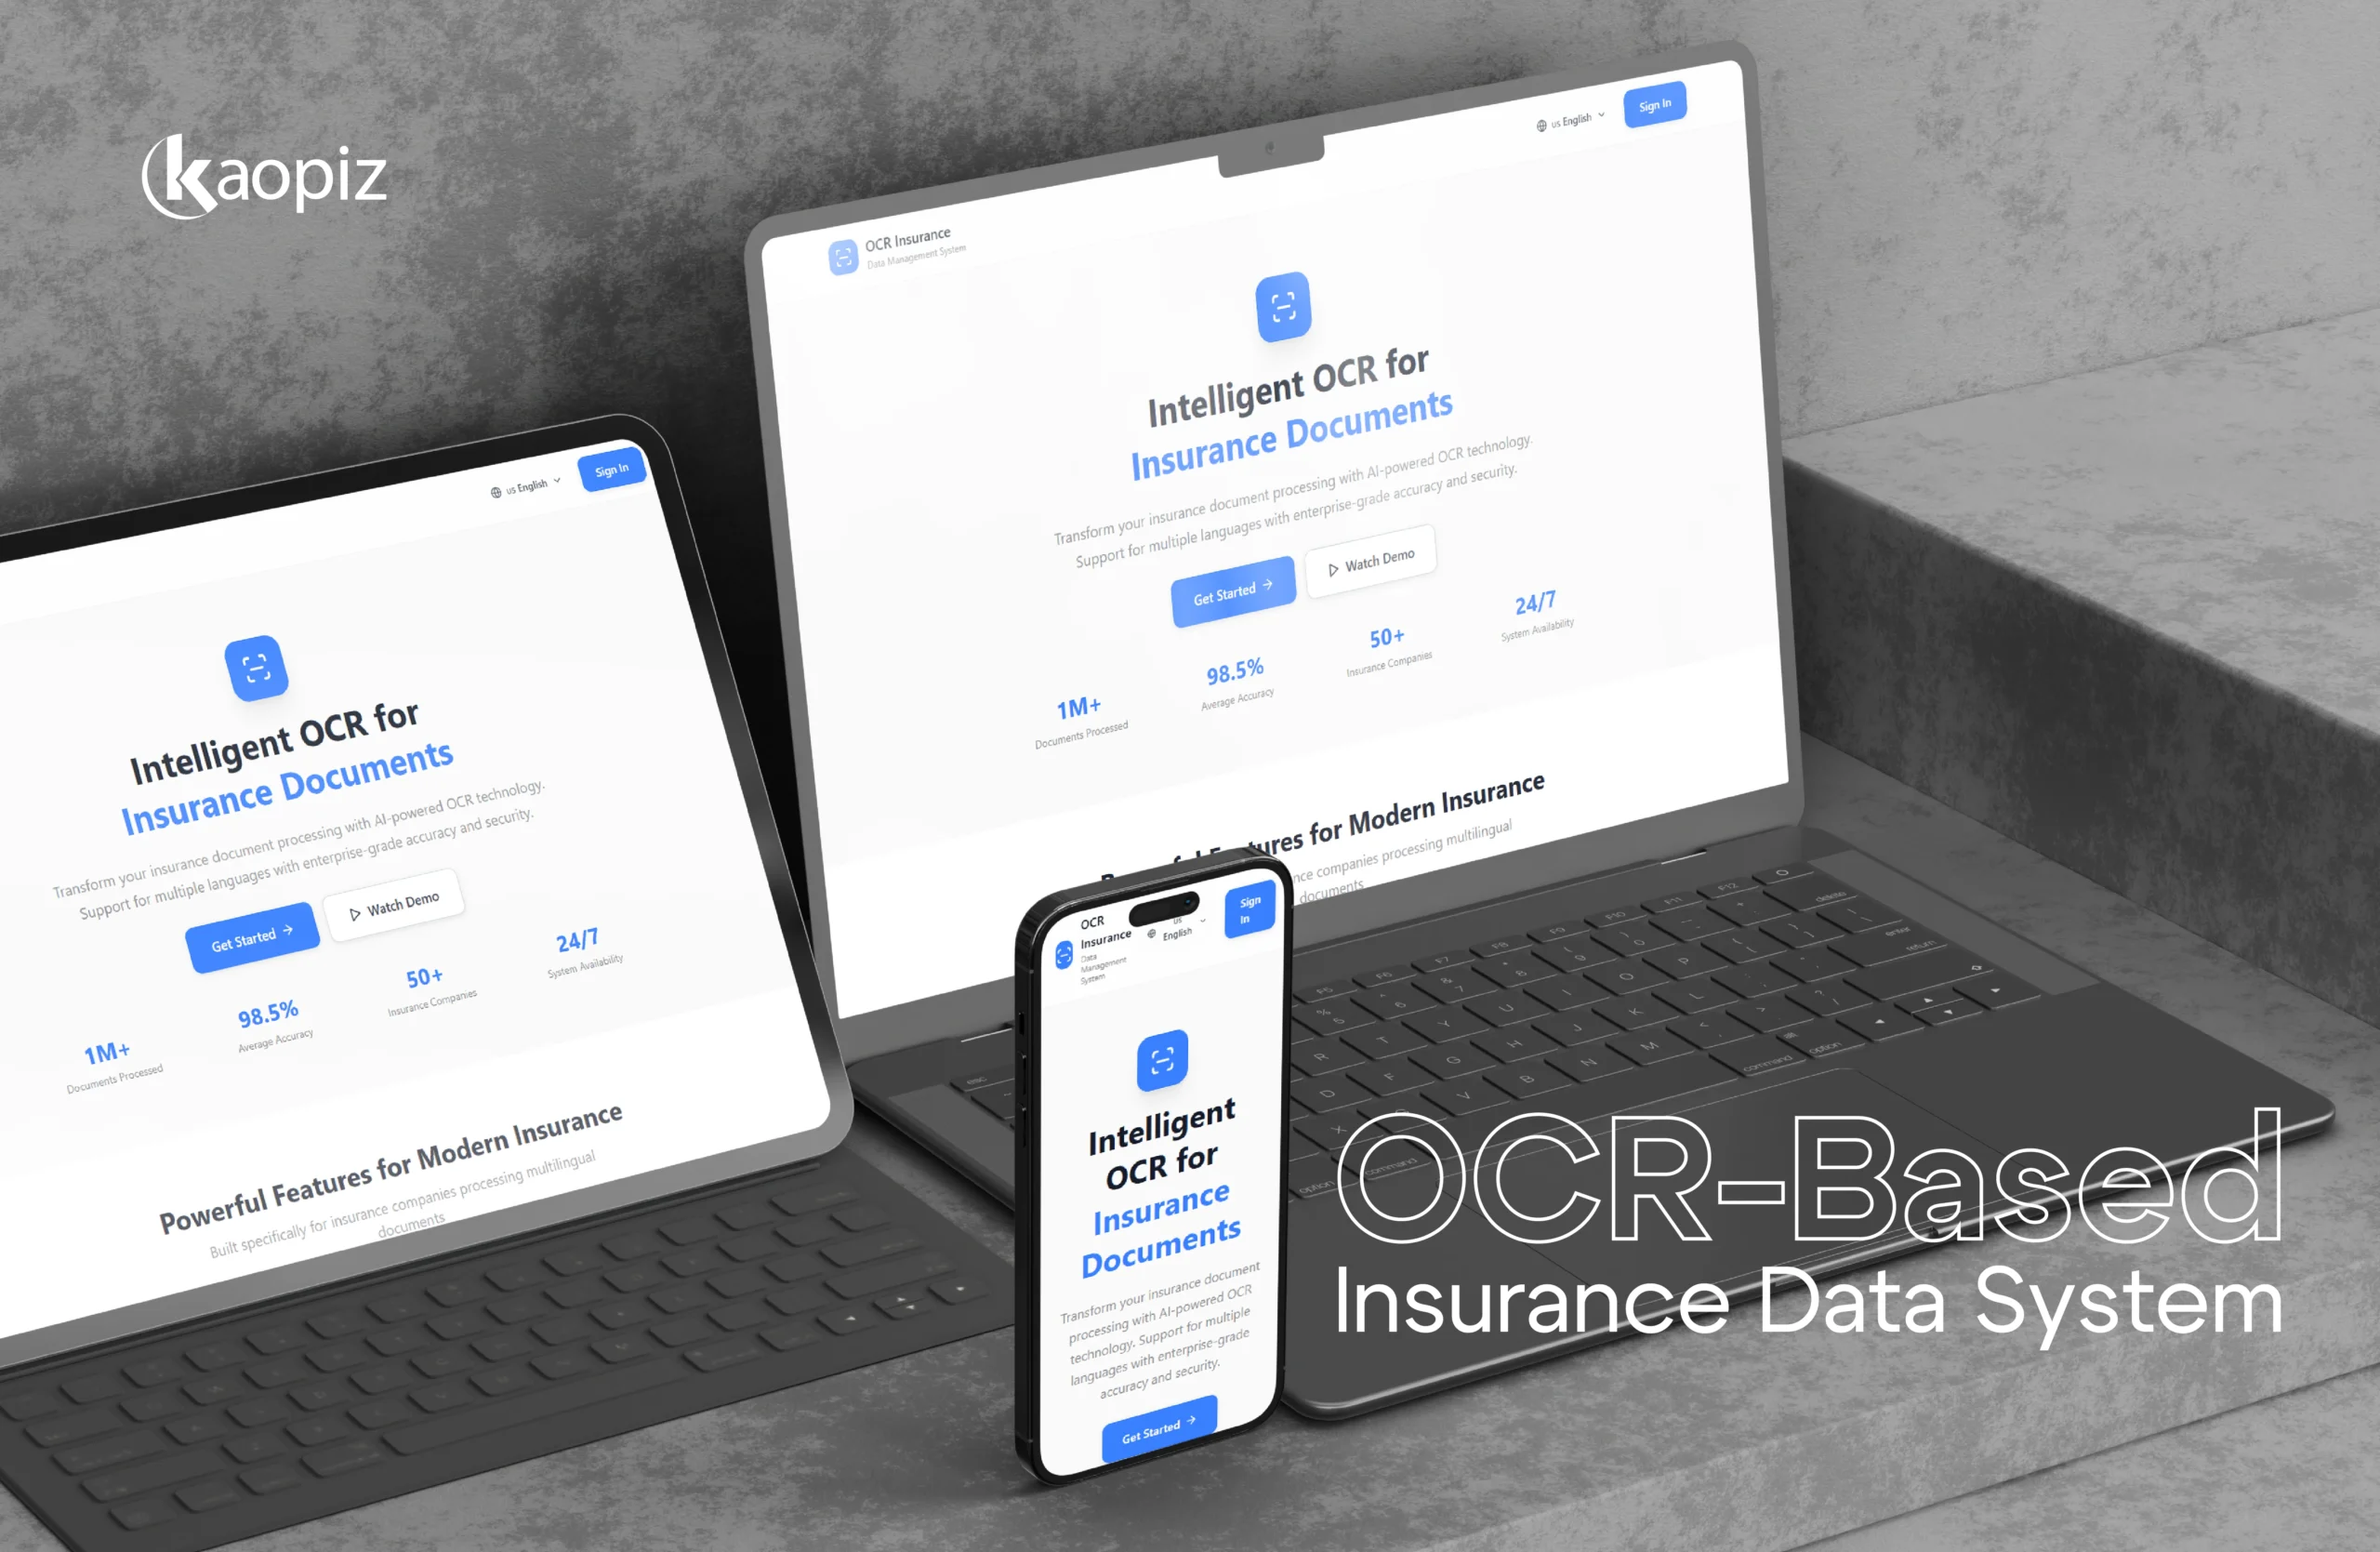
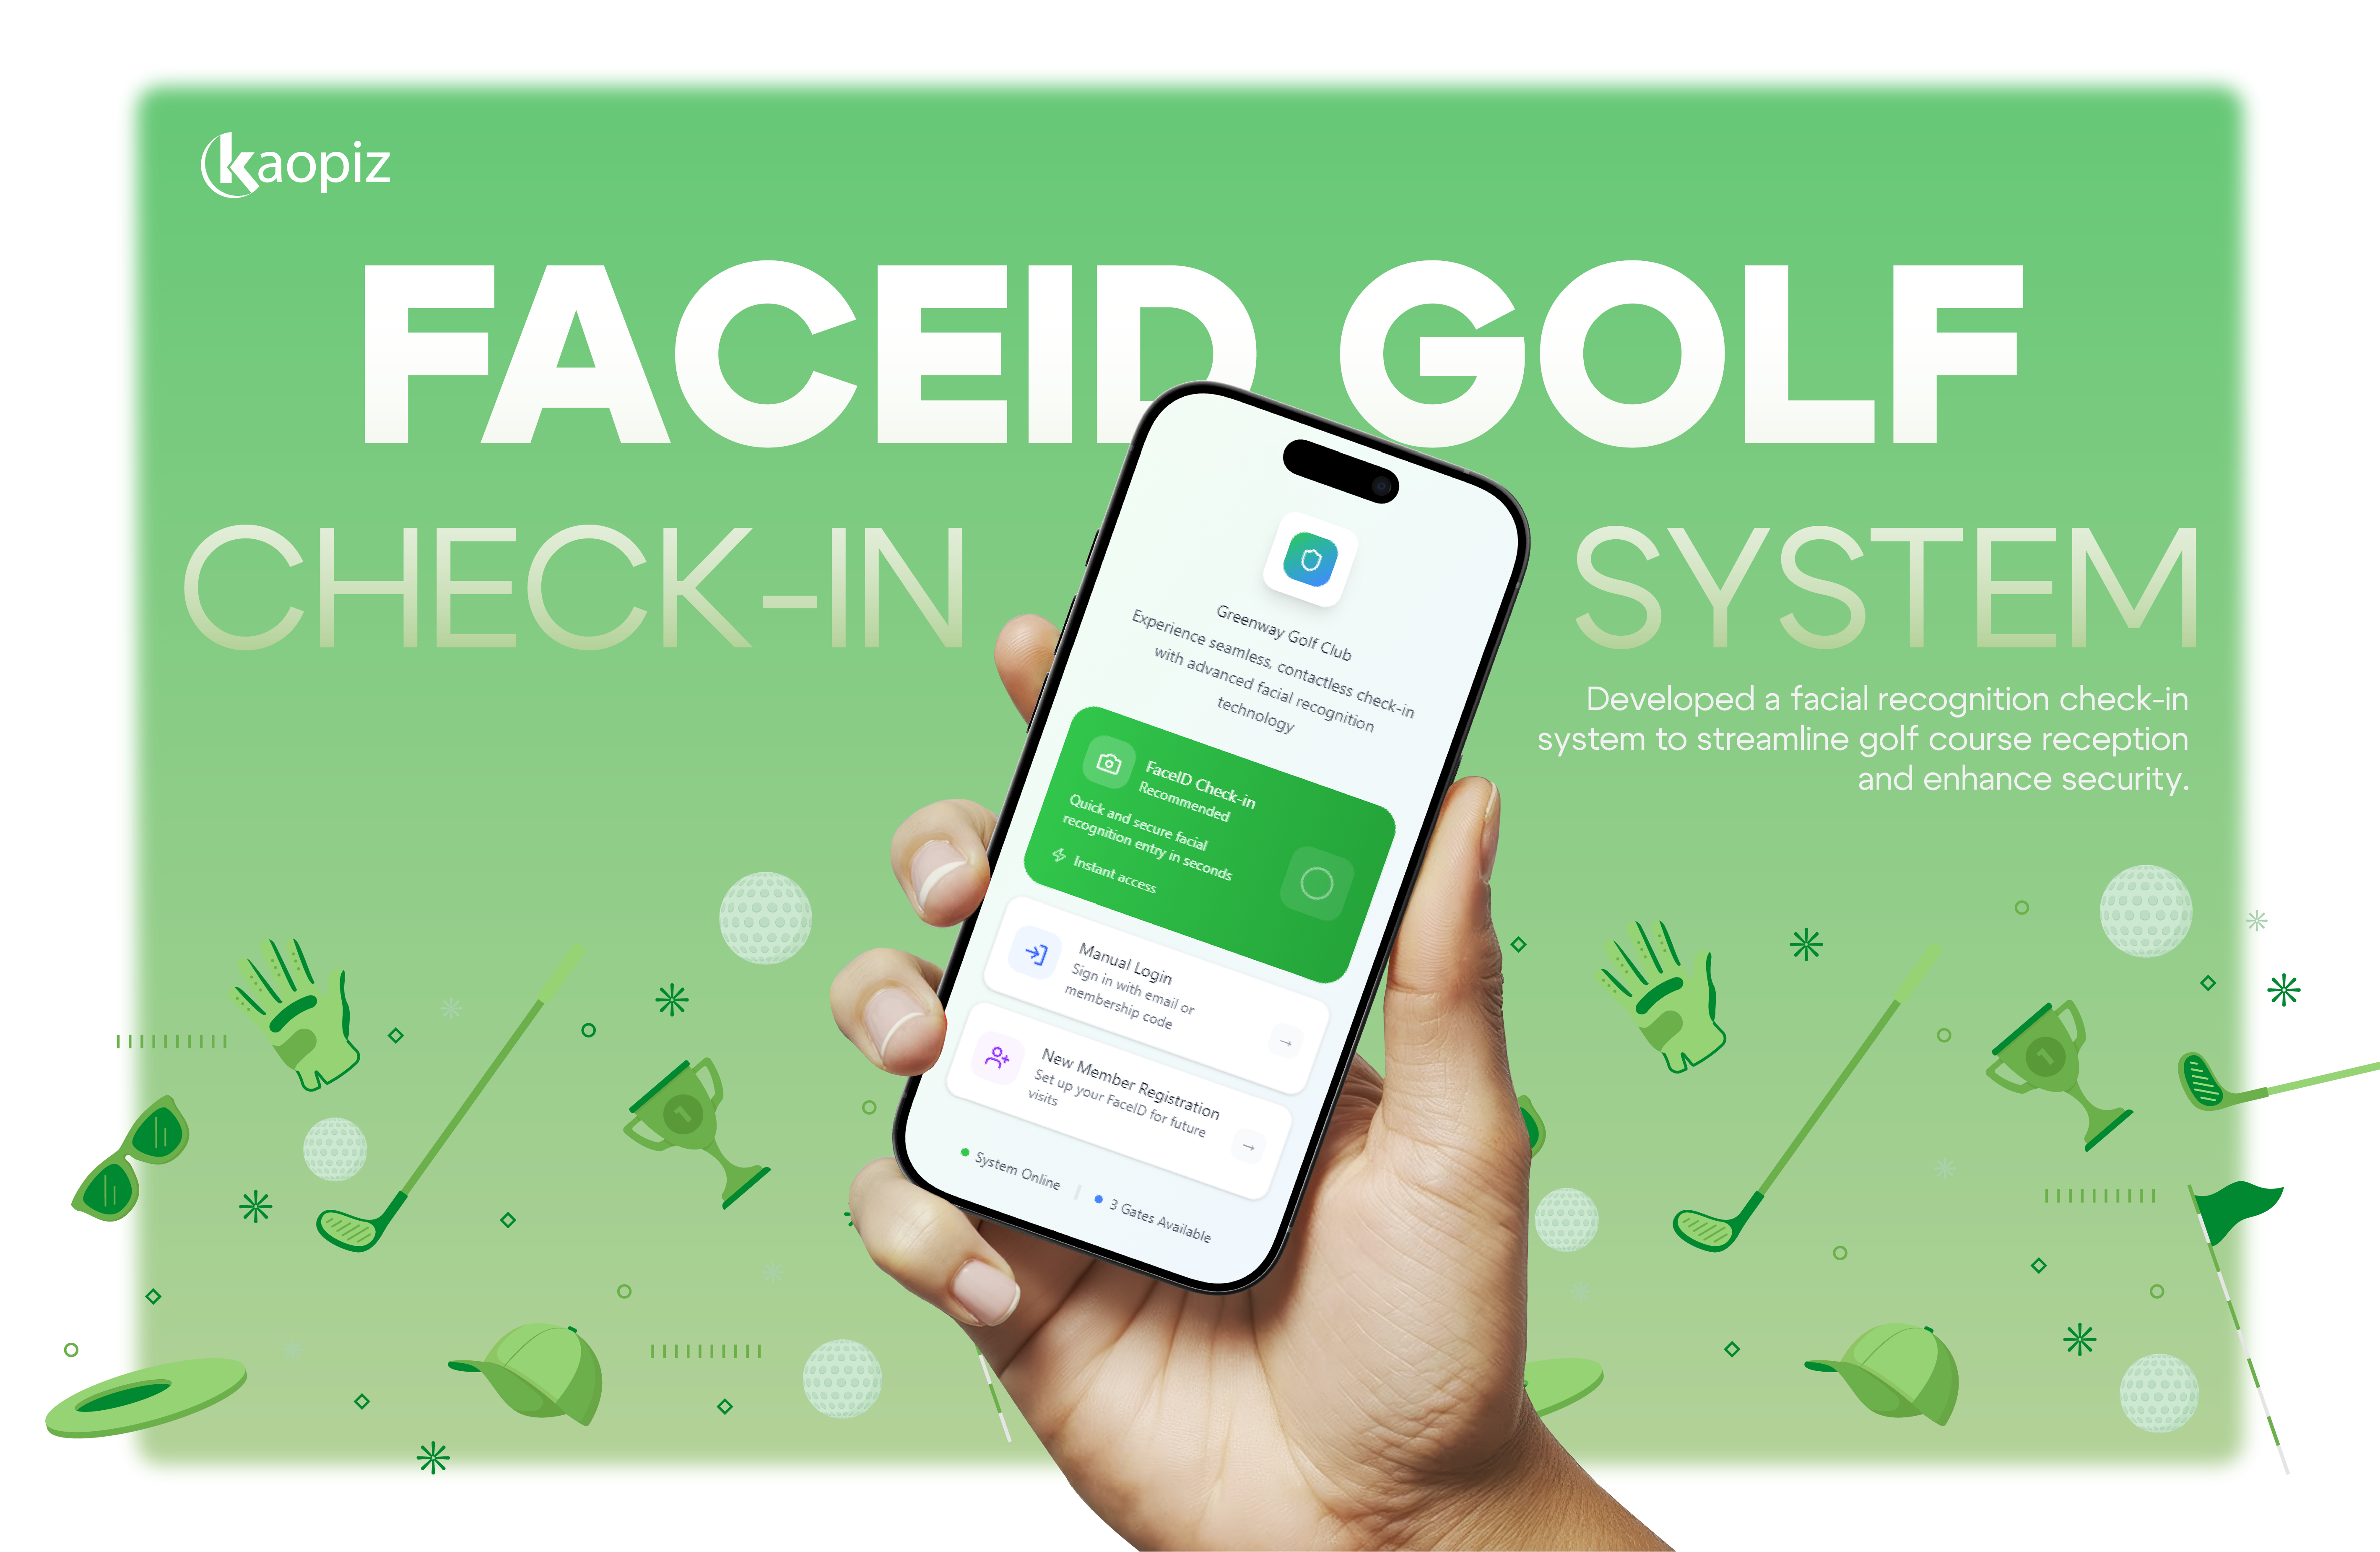
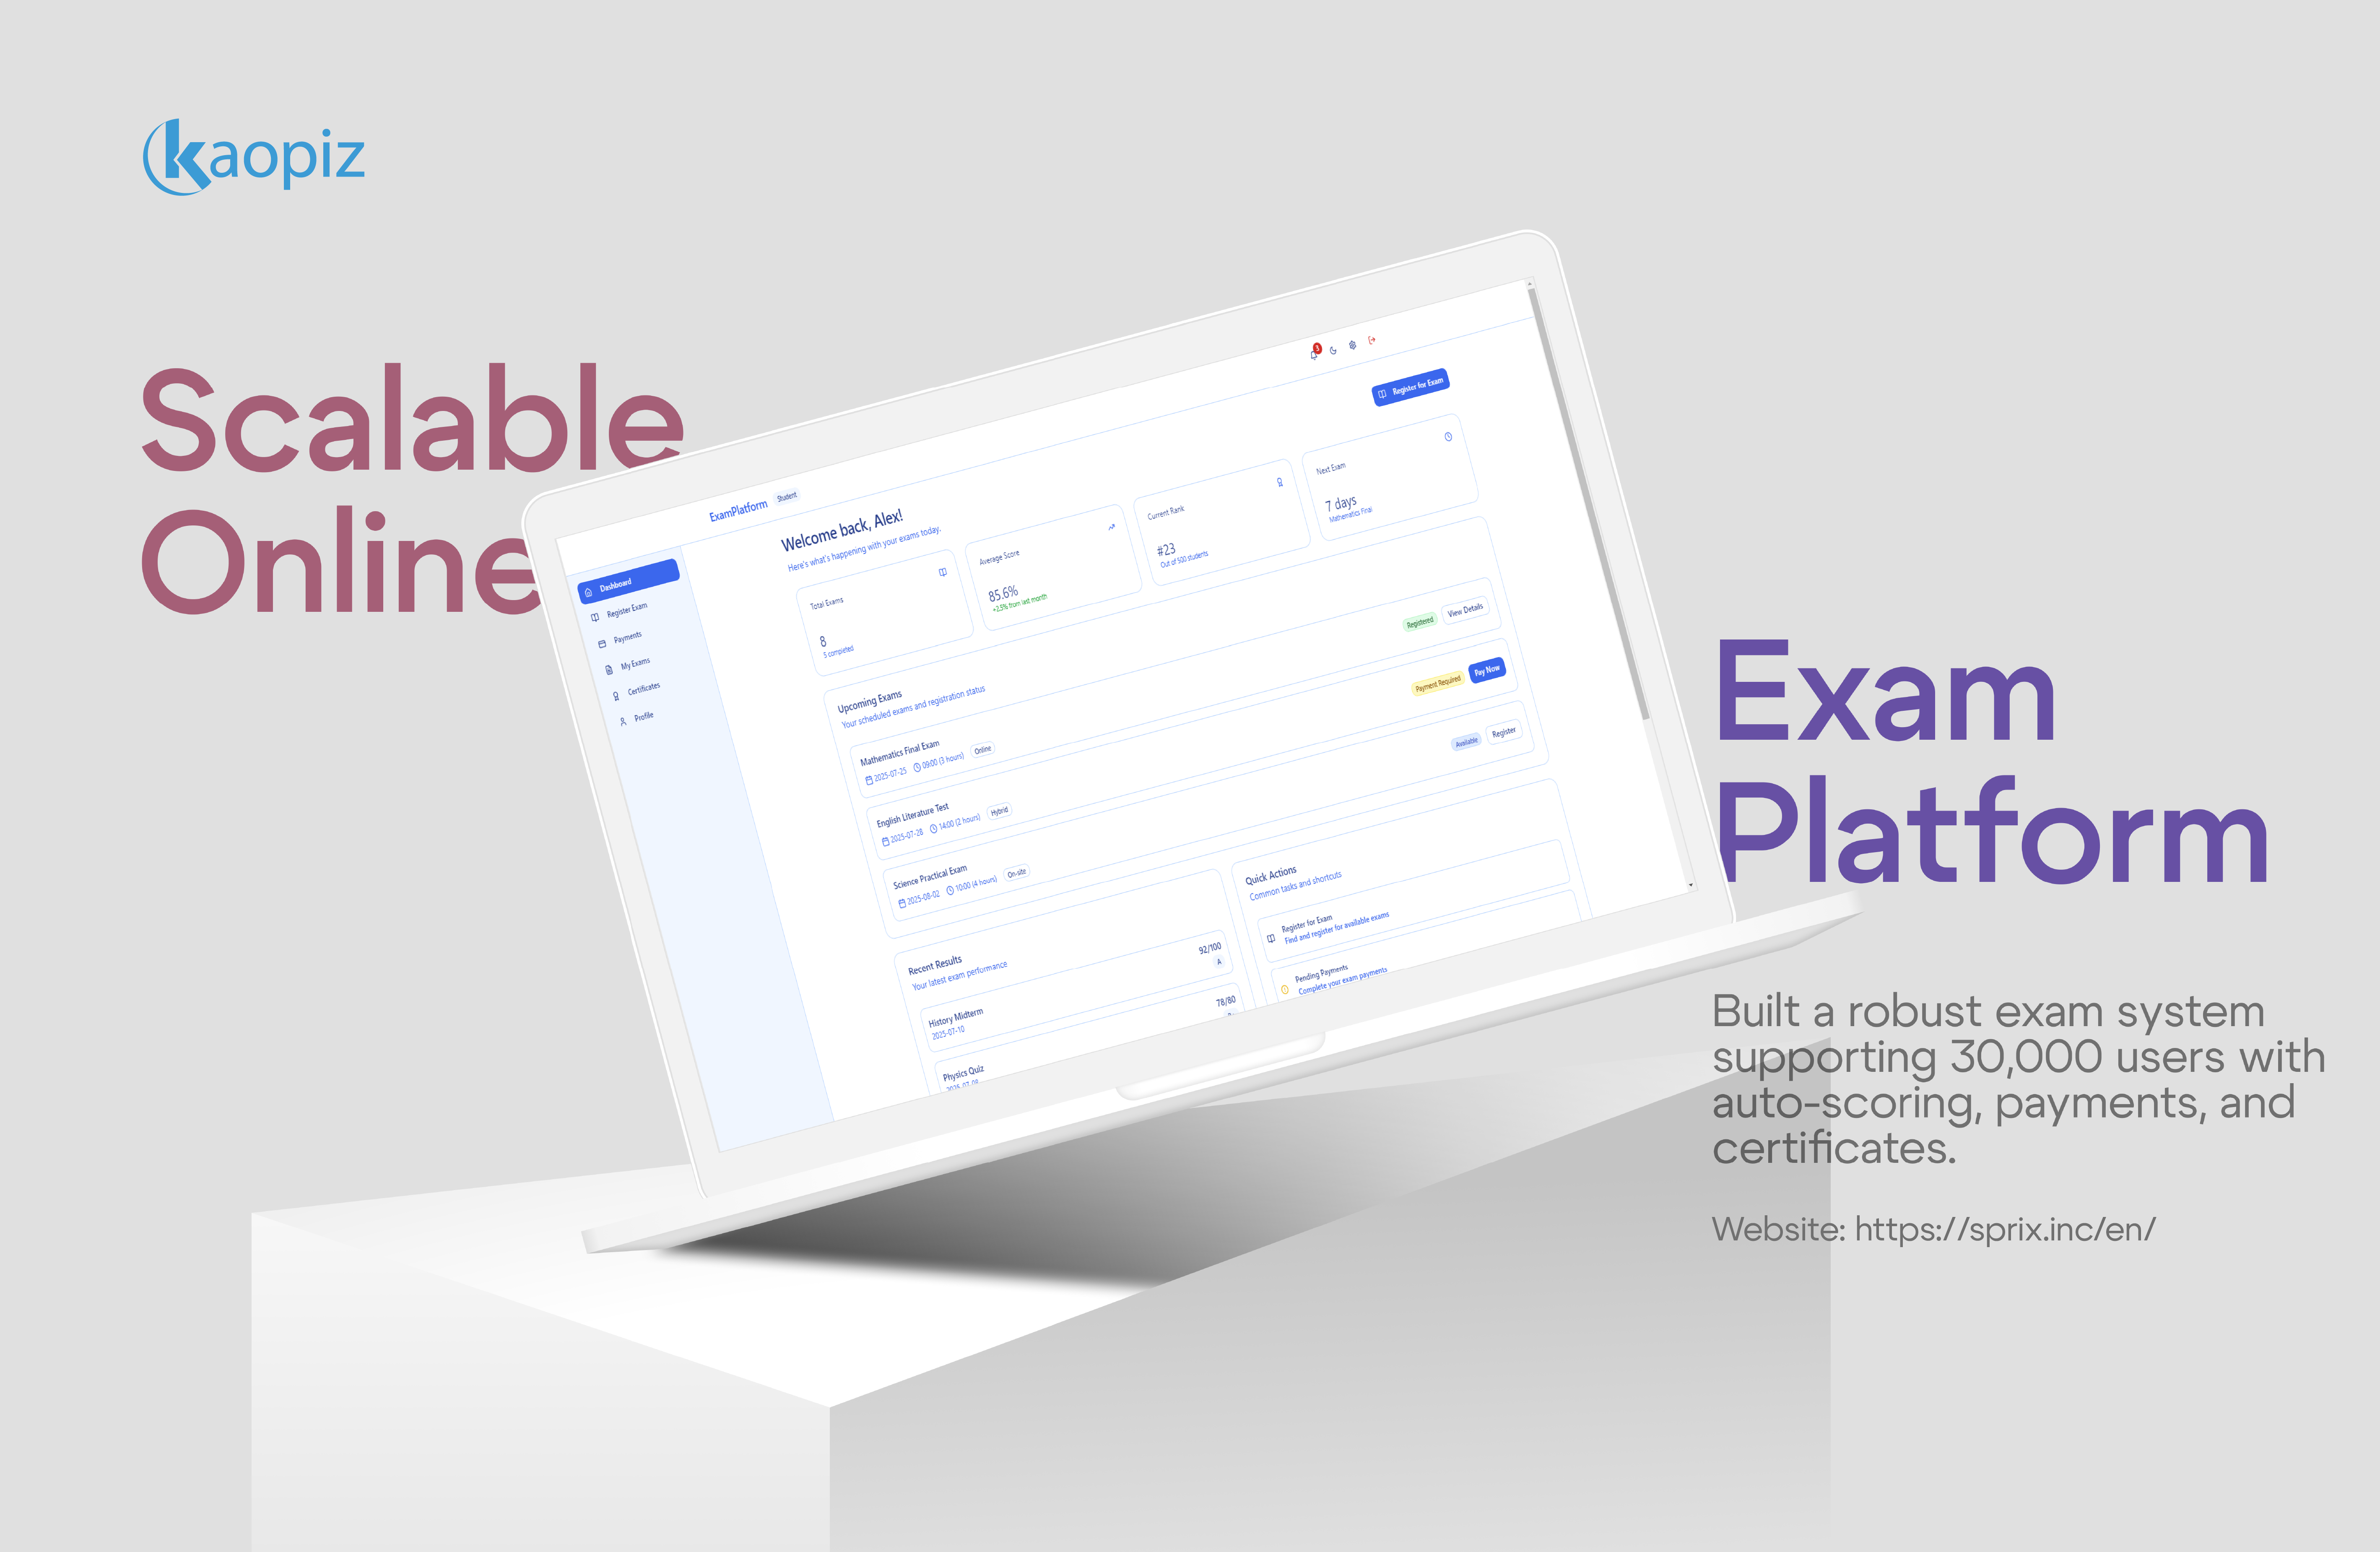
Our Clients Journeys
Our Clients Journeys
Let’s talk about your project
Contact Kaopiz today and let’s build your scalable future together!